- マーケット分析
- テクニカル分析
「日本」通貨指数 テクニカル分析 - 「日本」通貨指数 取引:2017-07-31
Positive economic data came out in Japan
In this review, we suggest considering the personal composite instrument (PCI) "JPY vs. Currencies". It reflects the price dynamics of the Japanese yen against other world currencies. Is there a possibility of JPY_Index price growth?
The PCI increases in case of the Japanese yen strengthening against other major world currencies. On Friday morning, positive economic data came out in Japan. Household spending increased by 2.3% in June, which is the highest level since August 2015. This was contributed by an improvement in the availability of workplaces to the 43-year high and a decrease in unemployment to 2.8%. In fact, Japan shows the best situation in the labor market among developed countries. The core inflation in June was 0.4%. This is much lower than the Bank of Japan target level of 2%. The economic indicators allow the Japanese regulator to continue to pursue a loose monetary policy and stimulate economic development. Thanks to this the country’s GDP has been growing for the 5th consecutive quarter. Most likely, economic growth will continue on the background of the bold increase in consumer spending, amounting to 60% of the Japanese GDP.
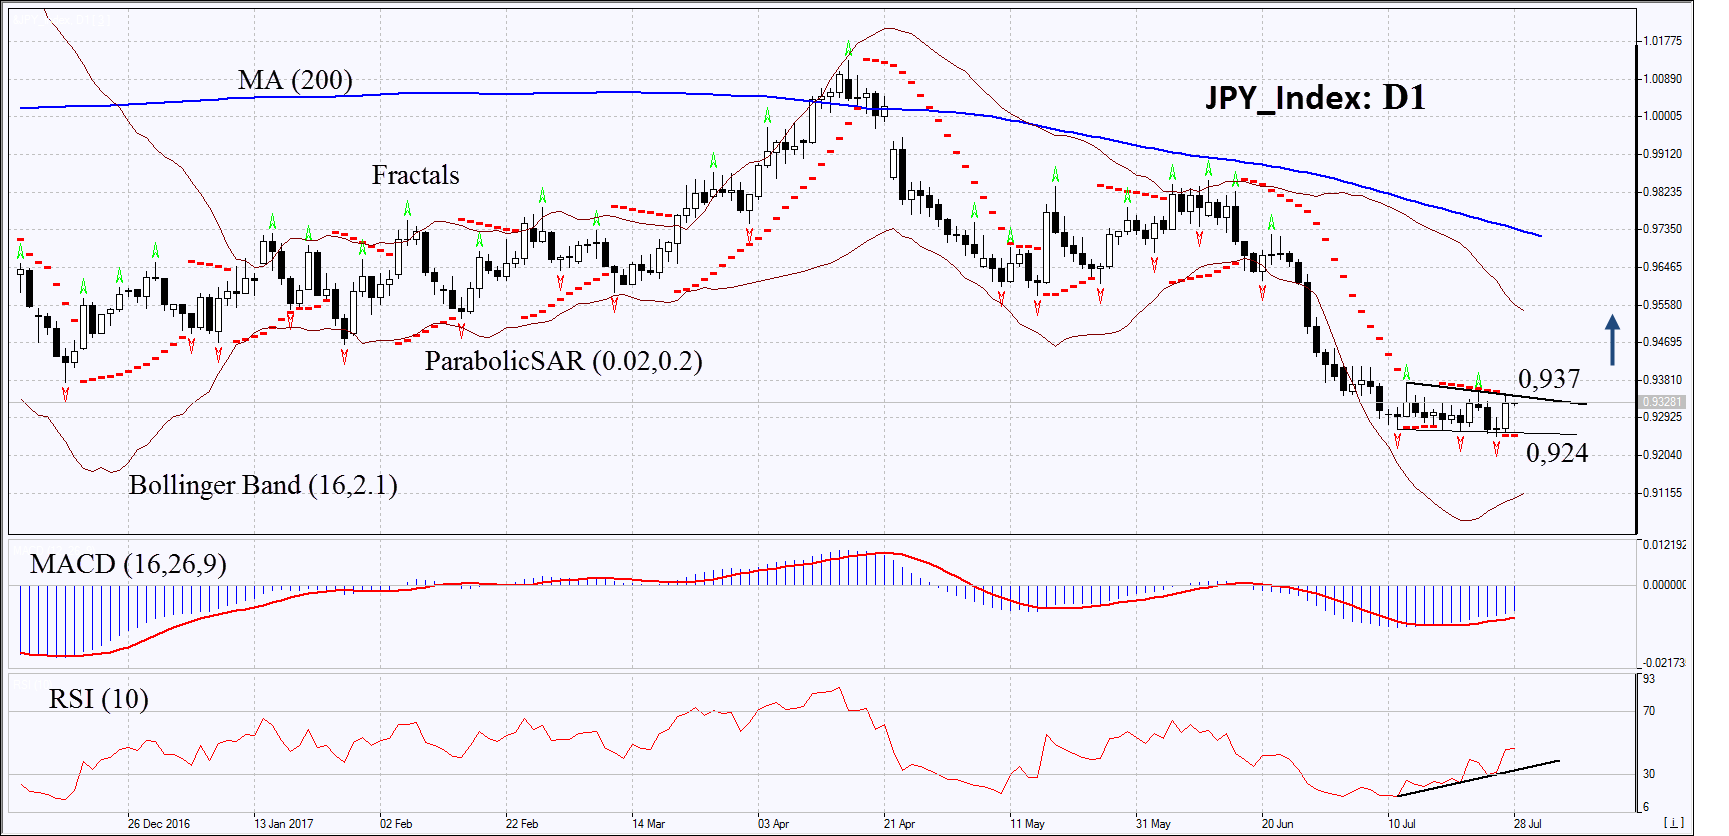
On the daily timeframe, JPY_Index: D1 is within the narrow range after a significant drop. The price reversal is possible in case of the improvement of the Japanese economic indicators.
- The Parabolic indicator gives a bullish signal.
- The Bollinger bands have widened, which means higher volatility. The lower band is tilted upwards.
- The RSI indicator is below 50. It has formed a positive divergence.
- The MACD indicator gives a bullish signal.
The bullish momentum may develop in case JPY_Index exceeds the two last fractal highs at 0.937. This level may serve as an entry point. The initial stop loss may be placed below the 15-month low, the last fractal low and the Parabolic signal at 0.924. After opening the pending order, we shall move the stop to the next fractal low following the Bollinger and Parabolic signals. Thus, we are changing the potential profit/loss to the breakeven point. More risk-averse traders may switch to the 4-hour chart after the trade and place there a stop loss moving it in the direction of the trade. If the price meets the stop level at 0.924 without reaching the order at 0.937 we recommend cancelling the position: the market sustains internal changes that were not taken into account.
Summary of technical analysis
| Position | Buy |
| Buy stop | above 0,937 |
| Stop loss | below 0,924 |
- コースを取って、

【重要な注意事項】:
本レポートは、当社の親会社であるアイエフシーマーケットが作成したものの邦訳です。本レポートには、当社のサービスと商品についての情報を含みますが、お客様の投資目的、財務状況、資金力にかかわらず、情報の提供のみを目的とするものであり、金融商品の勧誘、取引の推奨、売買の提案等を意図したものではありません。 本レポートは、アイエフシーマーケットが信頼できると思われる情報にもとづき作成したものですが、次の点に十分ご留意ください。アイエフシーマーケットおよび当社は、本レポートが提供する情報、分析、予測、取引戦略等の正確性、確実性、完全性、安全性等について一切の保証をしません。アイエフシーマーケットおよび当社は、本レポートを参考にした投資行動が利益を生んだり損失を回避したりすることを保証または約束あるいは言外に暗示するものではありません。アイエフシーマーケットおよび当社は、本レポートに含まれる不確実性、不正確性、不完全性、誤謬、文章上の誤り等に起因して、お客様または第三者が損害(直接的か間接的かを問いません。)を被った場合でも、一切の責任を負いません。
