- マーケット分析
- テクニカル分析
天然ガス テクニカル分析 - 天然ガス 取引:2019-07-10
EIA raises US natural gas consumption forecast
The United States Energy Information Administration (EIA) raised its forecast for US natural gas consumption for 2019 and 2020. Will the NATGAS quotations growth continue ?
EIA published the Energy Overview (Short-Term Energy Overview) for July. Compared to the June overview, gas consumption in the United States is expected to increase by 0.42 billion cubic feet per day to 84.59 billion cubic meters in 2019 and by 0.16 billion cubic feet per day to 2020 to 84.54 billion. In other words, gas consumption should be reduced in the United States next year. It is difficult to say whether this is possible. This EIA forecast assumes the recovery of US natural gas reserves. For a long time (from September 2017) they are below their 5-year average. And in March of the current year they were one third lower than this average. Large-scale plans to increase the export of American liquefied natural gas (LNG) can help reduce reserves and increase quotes for ordinary natural gas. In this and next years, several large LNG terminals will be launched in the USA. Note that, according to U.S. The Commodity Futures Trading Commission for the past week, the number of positions for the sale of natural gas (net short) reached a maximum since November 2015, and the number of positions for purchase (net longs) has been at a minimum since December 2011. If speculators are forced to close short positions, the upward movement of gas quotations may receive an additional impetus.
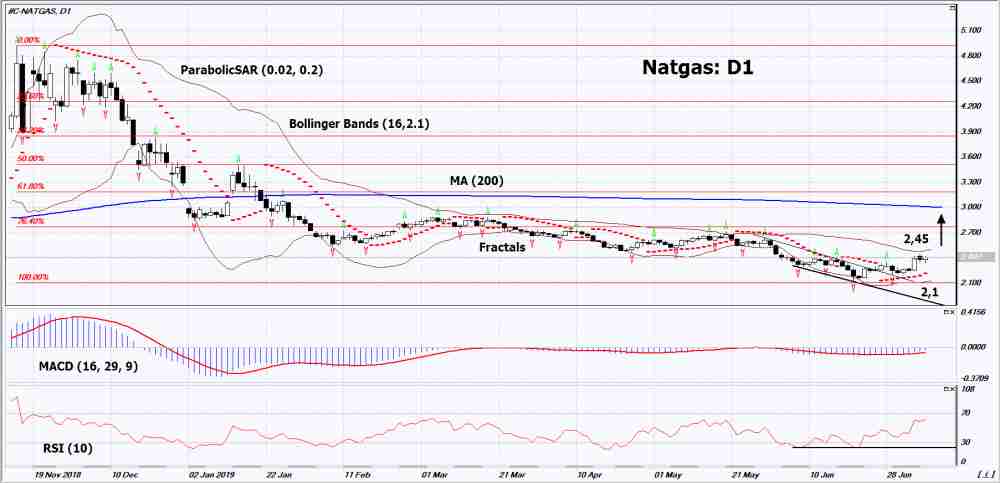
On a daily timeframe Natgas: D1 broke up the downtrend resistance line and adjusted upward. Various technical analysis indicators have generated an uptrend signals. Further growth of quotations is possible in case of an increase in demand in the USA and a massive closure of short positions.
- The Parabolic indicator shows a signal to increase.
- The Bolinger bands narrowed, indicating a volatility decrease. Both Bollinger lines are sloping up.
- the RSI indicator is above the 50 mark. It formed a weak divergence to increase.
- The MACD indicator gives bullish signal.
The bullish momentum may develop if Natgas exceeds its last maximum: 2.45. This level can be used as an entry point. The initial stop lose may be placed below the two last lower fractals, the bottom Bollinger line, the minimum since May 2016 and the Parabolic signal: 2.1. After opening the pending order stop shall be moved folowing the signals of Bollinger and Parabolic to the next fractal minimum.Thus, we are changing the potential profit/loss to the breakeven point. More risk-averse traders may switch to the 4-hour chart after the trade and place a stop loss moving it in the direction of the trade. If the price meets the stop level (2,1) without reaching the order (2,45), we recommend to cancel the order: the market sustains internal changes that were not taken into account.
Technical Analysis Summary
| Position | Buy |
| Buy stop | Above 2,45 |
| Stop loss | Below 2,1 |
- コースを取って、

【重要な注意事項】:
本レポートは、当社の親会社であるアイエフシーマーケットが作成したものの邦訳です。本レポートには、当社のサービスと商品についての情報を含みますが、お客様の投資目的、財務状況、資金力にかかわらず、情報の提供のみを目的とするものであり、金融商品の勧誘、取引の推奨、売買の提案等を意図したものではありません。 本レポートは、アイエフシーマーケットが信頼できると思われる情報にもとづき作成したものですが、次の点に十分ご留意ください。アイエフシーマーケットおよび当社は、本レポートが提供する情報、分析、予測、取引戦略等の正確性、確実性、完全性、安全性等について一切の保証をしません。アイエフシーマーケットおよび当社は、本レポートを参考にした投資行動が利益を生んだり損失を回避したりすることを保証または約束あるいは言外に暗示するものではありません。アイエフシーマーケットおよび当社は、本レポートに含まれる不確実性、不正確性、不完全性、誤謬、文章上の誤り等に起因して、お客様または第三者が損害(直接的か間接的かを問いません。)を被った場合でも、一切の責任を負いません。
