- マーケット分析
- テクニカル分析
非周期的な株価指数 テクニカル分析 - 非周期的な株価指数 取引:2019-08-07
The cyclical nature of the American labor market may affect the dynamics of PCI.
In this review, we suggest to consider a personal composite instrument (PCI) Non-cyclical_Stocks - Stock Index Non-cyclic stocks. It reflects the price dynamics of a portfolio of 6 shares of the world's largest companies that produce consumer goods and services. Will the Non-cyclical_Stocks quotations fall?
After the announcement of new duties on Chinese goods, a correction began on the US stock market. Investors fear China’s retaliation and sanctions on US goods. Regarding American companies in the consumer sector, it can be noted that the unemployment rate in the US is now 3.7%. This is a minimum since 1969. The American labor market, as a rule, shows a cyclicality around an average level of 6%. In case of an increase in unemployment to the average historical level, the income of consumer companies may decrease.
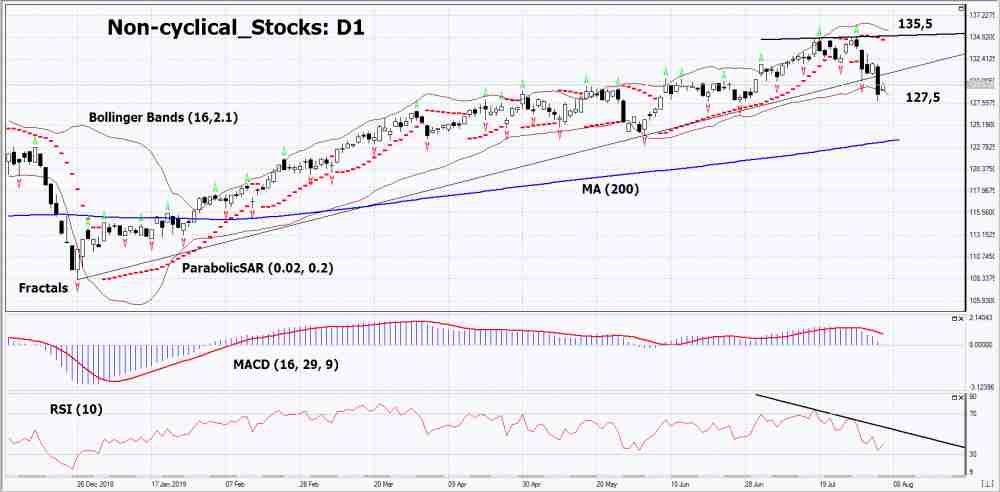
On the daily timeframe Non-cyclical_Stocks: D1 has broken down the uptrend support line. Technical analysis indicators formed a downtrend signal. Further downward correction is possible in case of publication of negative macroeconomic and corporate data.
- The Parabolic indicator demonstrates a downtrend signal.
- The Bolinger bands widened, indicating a volatility increase. Both Bollinger Lines Slope Down.
- The RSI indicator is below the 50 mark . It has formed a divergence to decrease.
- The MACD indicator gives a bearish signal.
The bearish momentum may develop if Non-cyclical_Stocks drops below its last low: 127.5. This level can be used as an entry point. The initial stop lose may be placed higher than the last upper fractal, historical high, Bollinger upper line and Parabolic signal: 135.5. After opening the pending order, the stop shall be moved following the signals of Bollinger and Parabolic to the next fractal minimum. Thus, we are changing the potential profit/loss to the breakeven point. More risk-averse traders may switch to the 4-hour chart after the trade and place a stop loss moving it in the direction of the trade. If the price meets the stop level (135,5) without reaching the order (127,5), we recommend to cancel the order: the market sustains internal changes that were not taken into account.
Technical Analysis Summary
| Position | Sell |
| Sell stop | Below 127,5 |
| Stop loss | Above 135,5 |
- コースを取って、

【重要な注意事項】:
本レポートは、当社の親会社であるアイエフシーマーケットが作成したものの邦訳です。本レポートには、当社のサービスと商品についての情報を含みますが、お客様の投資目的、財務状況、資金力にかかわらず、情報の提供のみを目的とするものであり、金融商品の勧誘、取引の推奨、売買の提案等を意図したものではありません。 本レポートは、アイエフシーマーケットが信頼できると思われる情報にもとづき作成したものですが、次の点に十分ご留意ください。アイエフシーマーケットおよび当社は、本レポートが提供する情報、分析、予測、取引戦略等の正確性、確実性、完全性、安全性等について一切の保証をしません。アイエフシーマーケットおよび当社は、本レポートを参考にした投資行動が利益を生んだり損失を回避したりすることを保証または約束あるいは言外に暗示するものではありません。アイエフシーマーケットおよび当社は、本レポートに含まれる不確実性、不正確性、不完全性、誤謬、文章上の誤り等に起因して、お客様または第三者が損害(直接的か間接的かを問いません。)を被った場合でも、一切の責任を負いません。
