- マーケット分析
- テクニカル分析
玄米 テクニカル分析 - 玄米 取引:2019-07-09
Bad weather can reduce rice harvest
Drought in India and worsening weather conditions in China can reduce yields. Will the rice quotation growth continue ?
According to the Indian Ministry of Agriculture & Farmers' Welfare as of July 5, 2019, the area of summer rice crops in the country was 5.2 million hectares. This is almost a quarter less than last year’s level for the same date. In India, the rainy season began because of the monsoons. It is usually observed from June to September. Already the 5th week in a row there is a lack of rain. Moreover, their number for the week ended July 3 was 6% lower than the average for the last 50 years. Lack of moisture can be a major factor in reducing the yield of rice and other crops in India. In China, there is increased heat, but precipitation is still common for midsummer. Note that the main global rice exporters are located in one region - in Asia: India, Thailand, Vietnam and Pakistan. China is the world's largest importer of rice.
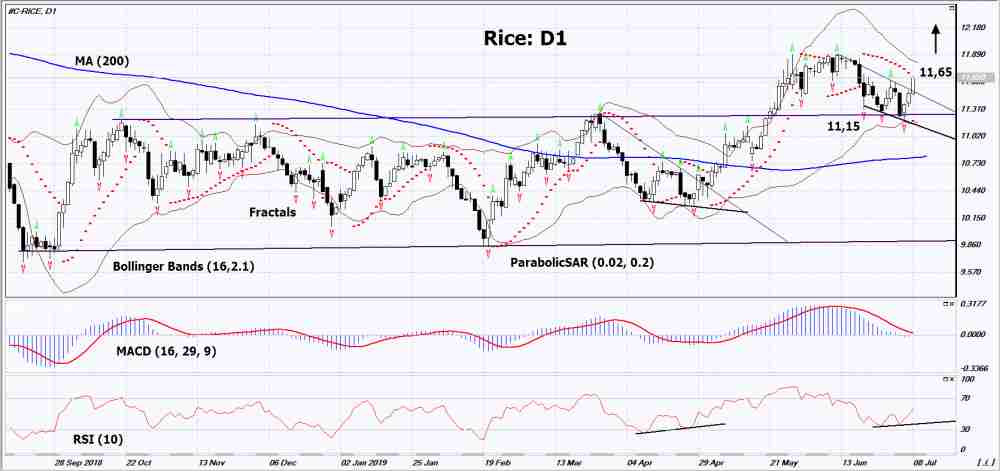
On the daily timeframe Rice: D1 is in the mid-term uptrend. The line of the previous neutral trend has now become a support level that was not broken down during the price correction. Various technical analysis indicators have generated an uptrend signals. Further growth of quotations is possible in case of a further reduction in world yield.
- The Parabolic indicator shows an uptrend signal.
- The Bolinger bands have narrowed, indicating a volatility decrease. The bottom line of Bollinger has a slope up.
- The RSI indicator is above the 50 mark. It has formed a divergence to increase.
- The MACD indicator shows a signal to increase.
The bullish momentum may develop in case if Rice exceeds its last maximum: 11.65. This level can be used as an entry point. The initial stop loss can be placed below the Parabolic signal, the last 2 lower fractal and the bottom Bollinger line: 11.15. After placing the pending order, the stop loss shall be moved following the signals of Bollinger and Parabolic to the next fractal minimum. Thus, we are changing the potential profit/loss to the breakeven point. More risk-averse traders may switch to the 4-hour chart after the trade and place a stop loss moving it in the direction of the trade. If the price meets the stop level (11,15) without reaching the order (11,65), we recommend to cancel the order: the market sustains internal changes that were not taken into account.
Technical Analysis Summary
| Position | Buy |
| Buy stop | Above 11,65 |
| Stop loss | Below 11,15 |
- コースを取って、

【重要な注意事項】:
本レポートは、当社の親会社であるアイエフシーマーケットが作成したものの邦訳です。本レポートには、当社のサービスと商品についての情報を含みますが、お客様の投資目的、財務状況、資金力にかかわらず、情報の提供のみを目的とするものであり、金融商品の勧誘、取引の推奨、売買の提案等を意図したものではありません。 本レポートは、アイエフシーマーケットが信頼できると思われる情報にもとづき作成したものですが、次の点に十分ご留意ください。アイエフシーマーケットおよび当社は、本レポートが提供する情報、分析、予測、取引戦略等の正確性、確実性、完全性、安全性等について一切の保証をしません。アイエフシーマーケットおよび当社は、本レポートを参考にした投資行動が利益を生んだり損失を回避したりすることを保証または約束あるいは言外に暗示するものではありません。アイエフシーマーケットおよび当社は、本レポートに含まれる不確実性、不正確性、不完全性、誤謬、文章上の誤り等に起因して、お客様または第三者が損害(直接的か間接的かを問いません。)を被った場合でも、一切の責任を負いません。
