- マーケット分析
- テクニカル分析
大豆 テクニカル分析 - 大豆 取引:2018-12-03
The US and China can remove part of the mutual restrictions in foreign trade
The leaders of the United States and China will negotiate at the G20 summit. Among other things, they will discuss issues of US soybean imports to China. Will SOYB prices rise?
In April of the current year, China increased import duties on US soybeans by 25% in response to restrictions on exports of a number of Chinese goods to the United States. After that, soybean prices also fell by nearly a quarter. In 2017, China accounted for 56% of US soybean exports. US President Donald Trump and Chinese President Xi Jinping participate in the G20 summit, which will be held from November 30 to December 1, 2018 in Argentina. The United States accounts for 35% of the world soybean harvest and another 33% and 14% are produced by Brazil and Argentina. In world soybean exports, the United States accounts for 37%. Brazil accounts for 47% and Argentina - only 5%. In case of a reduction in customs tariffs and resumption of US soybean supplies to China, its prices may noticeably increase.
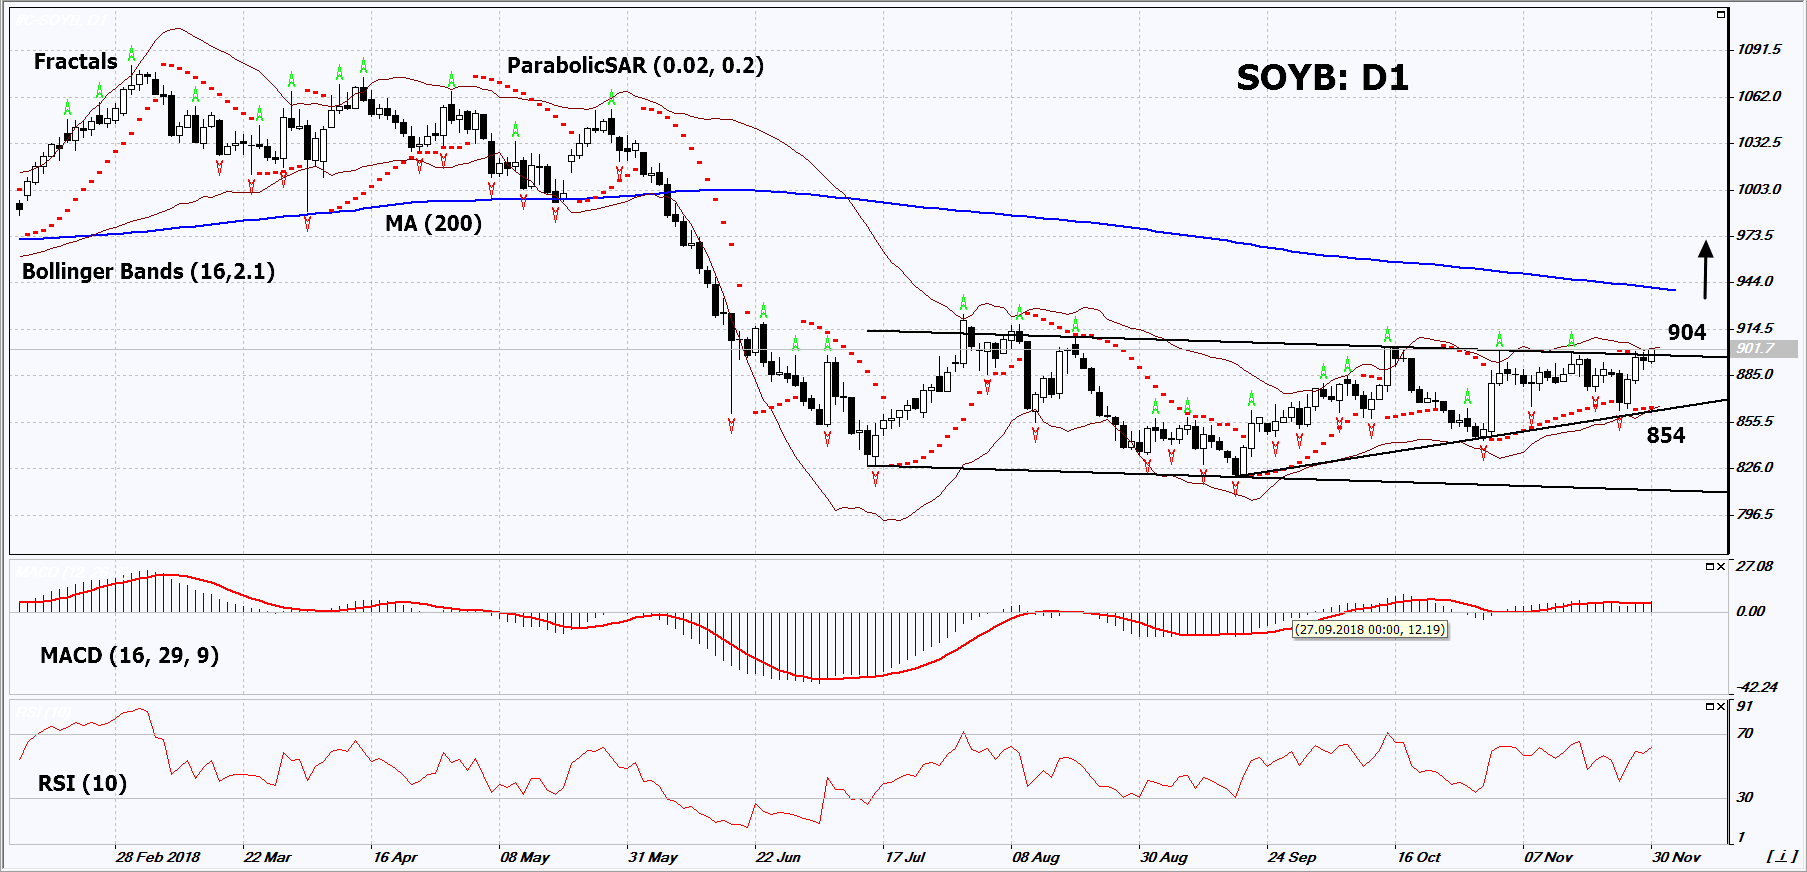
On the daily timeframe, SOYB: D1 approached the upper boundary of the neutral range. A number of technical analysis indicators formed buy signals. The further price increase is possible in case of a resumption of demand by non-Chinese buyers and a reduction in duties.
- The Parabolic indicator gives a bullish signal.
- The Bollinger bands have narrowed, which indicates low volatility. Both bands are titled upwards.
- The RSI indicator is above 50. It has not reached the overbought area yet. No divergence.
- The MACD indicator gives a bullish signal.
The bullish momentum may develop in case SOYB exceeds the three last fractal highs and the upper Bollinger band at 904. This level may serve as an entry point. The initial stop loss may be placed below the last fractal low, the lower Bollinger band and the Parabolic signal at 854. After opening the pending order, we shall move the stop to the next fractal low following the Bollinger and Parabolic signals. Thus, we are changing the potential profit/loss to the breakeven point. More risk-averse traders may switch to the 4-hour chart after the trade and place there a stop loss moving it in the direction of the trade. If the price meets the stop level (854) without reaching the order (904), we recommend to close the position: the market sustains internal changes that were not taken into account.
Summary of technical analysis
| Position | Buy |
| Buy stop | Above 904 |
| Stop loss | Below 854 |
- コースを取って、

【重要な注意事項】:
本レポートは、当社の親会社であるアイエフシーマーケットが作成したものの邦訳です。本レポートには、当社のサービスと商品についての情報を含みますが、お客様の投資目的、財務状況、資金力にかかわらず、情報の提供のみを目的とするものであり、金融商品の勧誘、取引の推奨、売買の提案等を意図したものではありません。 本レポートは、アイエフシーマーケットが信頼できると思われる情報にもとづき作成したものですが、次の点に十分ご留意ください。アイエフシーマーケットおよび当社は、本レポートが提供する情報、分析、予測、取引戦略等の正確性、確実性、完全性、安全性等について一切の保証をしません。アイエフシーマーケットおよび当社は、本レポートを参考にした投資行動が利益を生んだり損失を回避したりすることを保証または約束あるいは言外に暗示するものではありません。アイエフシーマーケットおよび当社は、本レポートに含まれる不確実性、不正確性、不完全性、誤謬、文章上の誤り等に起因して、お客様または第三者が損害(直接的か間接的かを問いません。)を被った場合でも、一切の責任を負いません。
