- マーケット分析
- テクニカル分析
USD/JPY テクニカル分析 - USD/JPY 取引:2019-07-08
Bank of Japan does not rule out further rate cuts
Masayoshi Amamiya, Deputy Governor of the Bank of Japan, said that his department could further reduce the negative rate if it is needed to stimulate the economy. Will the USDJPY quotations grow?
Such a move indicates the weakening of the yen against the US dollar. The rate of the Bank of Japan is now -0.1% with annual inflation + 0.7%. At the same time, the target inflation rate is much higher and amounts to + 2%. Japan's GDP growth in the 1st quarter of 2019 was + 2.2% in annual terms. The Bank of Japan strives to keep it at this high level and expresses its readiness for an additional rate cut, if necessary. Such a monetary policy may contribute to the weakening of the yen. The US dollar index rose significantly due to the publication of good data on the US labor market in June. The number of new jobs (Non-farm payrolls) exceeded forecasts and turned out to be the maximum in 5 months. The Fed rate is now 2.5%. According to all forecasts, it will be reduced by 0.25% at the next meeting on July 31.
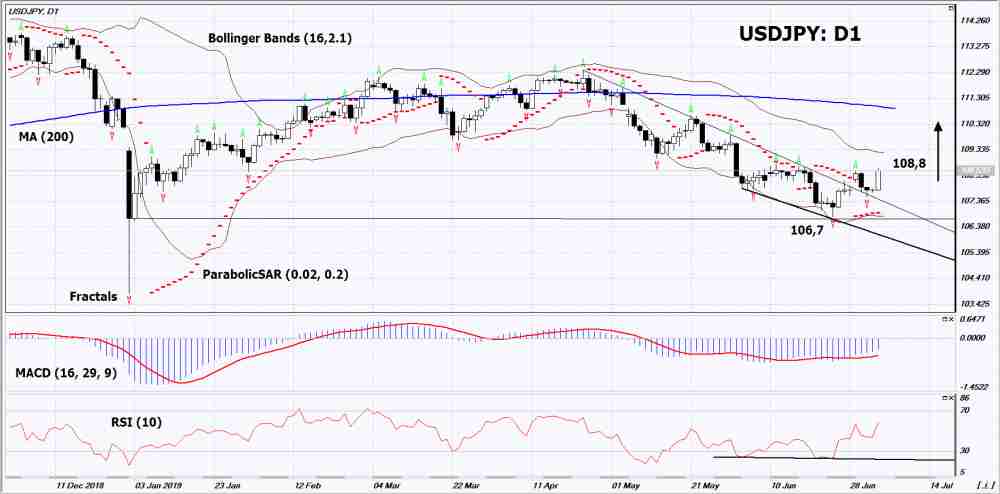
On the daily timeframe USDJPY: D1 came out of the downtrend. Various technical analysis indicators have generated uptrend signals. Further growth of quotes is possible in case of publication of negative macroeconomic data in Japan and positive in the United States.
- The Parabolic indicator indicates uptrend signal.
- The Bolinger bands narrowed, indicating volatility decrease . The bottom line of Bollinger has a slope up.
- The RSI indicatoris above the 50 mark. It formed a weak divergence to the rise.
- The MACD indicator gives bullish signal.
The bullish momentum may develop if USDJPY exceeds the last 3 upper fractals: 108.8. This level can be used as an entry point. This level can be used as an entry point. The initial stop loss can be placed below the signal of the Parabolic, the lower fractal and the lower Bollinger line: 106.7. After placing the pending order, the stop loss shall be moved following the signals of Bollinger and Parabolic to the next fractal minimum. Thus, we are changing the potential profit/loss to the breakeven point. More risk-averse traders may switch to the 4-hour chart after the trade and place a stop loss moving it in the direction of the trade. If the price meets the stop level (106,7) without reaching the order (108,8), we recommend to cancel the order: the market sustains internal changes that were not taken into account.
Technical Analysis Summary
| Position | Buy |
| Buy stop | Above 108,8 |
| Stop loss | Below 106,7 |
- コースを取って、

【重要な注意事項】:
本レポートは、当社の親会社であるアイエフシーマーケットが作成したものの邦訳です。本レポートには、当社のサービスと商品についての情報を含みますが、お客様の投資目的、財務状況、資金力にかかわらず、情報の提供のみを目的とするものであり、金融商品の勧誘、取引の推奨、売買の提案等を意図したものではありません。 本レポートは、アイエフシーマーケットが信頼できると思われる情報にもとづき作成したものですが、次の点に十分ご留意ください。アイエフシーマーケットおよび当社は、本レポートが提供する情報、分析、予測、取引戦略等の正確性、確実性、完全性、安全性等について一切の保証をしません。アイエフシーマーケットおよび当社は、本レポートを参考にした投資行動が利益を生んだり損失を回避したりすることを保証または約束あるいは言外に暗示するものではありません。アイエフシーマーケットおよび当社は、本レポートに含まれる不確実性、不正確性、不完全性、誤謬、文章上の誤り等に起因して、お客様または第三者が損害(直接的か間接的かを問いません。)を被った場合でも、一切の責任を負いません。
