- マーケット分析
- テクニカル分析
USD/PLN テクニカル分析 - USD/PLN 取引:2019-11-06
Getting ready for a meeting of the Central Bank of Poland
The next meeting of the National Bank of Poland will be held on November 6, 2019. Will the USDPLN quotations continue growing?
The upward movement indicates weakening of the Polish zloty against the US dollar. It is expected that the National Bank of Poland will keep the rate at the current level of 1.5%, at which it has been since 2015. However, theoretically, the National Bank may announce any plans for easing monetary policy in the future. In October, the Polish PMI indicator of business activity in the industry fell to a minimum in 10 years and amounted to 45.6 points. Its decline has been observed for 12 consecutive months. It should be noted that on November 13 the balance of the current account for September will be published in Poland, and on November 14 - the GDP for the 3rd quarter. These data may also affect the dynamics of the zloty.
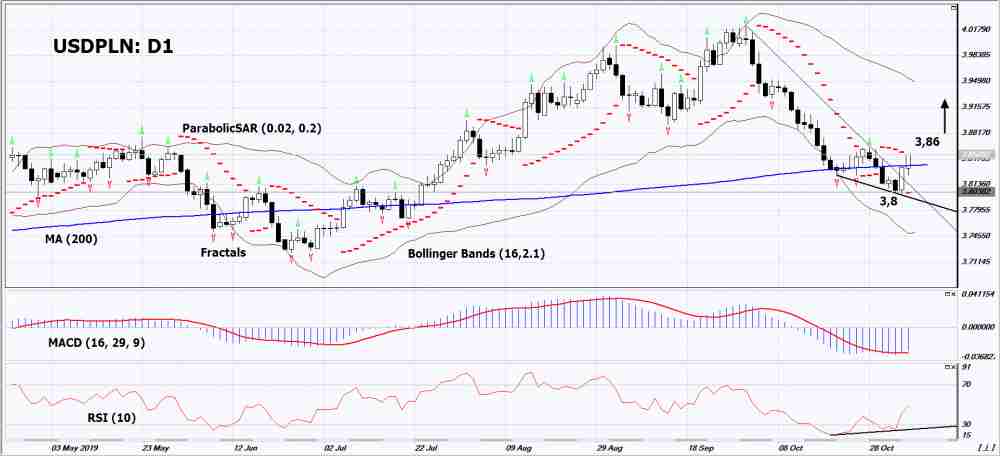
On the daily timeframe USDPLN: D1 broken up the resistance line of the falling trend. Now it is growing as part of the correction. Various technical analysis indicators have generated signals to increase. Further growth of quotations is possible if the monetary policy of the Polish National Bank is relaxed.
- The Parabolic indicator gives an uptrend signal.
- The Bolinger bands widened, indicating high volatility. The bottom line of the Bollinger has a slope up.
- The RSI indicator is below the 50 mark. It has formed a divergence to increase.
- The MACD indicator gives a bullish signal.
The bullish momentum may develop if USDPLN exceeds the last upper fractal: 3.86. This level can be used as an entry point. The initial stop lose may be placed below the Parabolic signal: 3.8. After the opening of the pending order, the stop shall be moved following the Bollinger and Parabolic signals to the next fractal minimum. Thus, we are changing the potential profit/loss to the breakeven point. More risk-averse traders may switch to the 4-hour chart after the trade and place a stop loss moving it in the direction of the trade. If the price meets the stop level (3,8) without reaching the order (3,86), we recommend to cancel the order: the market sustains internal changes that were not taken into account.
Technical Analysis Summary
| Position | Buy |
| Buy stop | Above 3,86 |
| Stop loss | Below 3,8 |
- コースを取って、

【重要な注意事項】:
本レポートは、当社の親会社であるアイエフシーマーケットが作成したものの邦訳です。本レポートには、当社のサービスと商品についての情報を含みますが、お客様の投資目的、財務状況、資金力にかかわらず、情報の提供のみを目的とするものであり、金融商品の勧誘、取引の推奨、売買の提案等を意図したものではありません。 本レポートは、アイエフシーマーケットが信頼できると思われる情報にもとづき作成したものですが、次の点に十分ご留意ください。アイエフシーマーケットおよび当社は、本レポートが提供する情報、分析、予測、取引戦略等の正確性、確実性、完全性、安全性等について一切の保証をしません。アイエフシーマーケットおよび当社は、本レポートを参考にした投資行動が利益を生んだり損失を回避したりすることを保証または約束あるいは言外に暗示するものではありません。アイエフシーマーケットおよび当社は、本レポートに含まれる不確実性、不正確性、不完全性、誤謬、文章上の誤り等に起因して、お客様または第三者が損害(直接的か間接的かを問いません。)を被った場合でも、一切の責任を負いません。
