- マーケット分析
- テクニカル分析
カナダドルに対する小麦 テクニカル分析 - カナダドルに対する小麦 取引:2019-03-13
Winter wheat crop has deteriorated in the US
In this review, we suggest considering the personal composite instrument (PCI) “Wheat vs. the Canadian dollar”. It increases when wheat prices rise on the world market and when the Canadian currency weakens. Is there a possibility for WHEAT/CAD prices to rise?
On Tuesday, wheat prices rose by almost 5% after the publication of the weekly overview by the U.S. Department of Agriculture (USDA). The US Department of Agriculture lowered the estimate of winter wheat crop in Texas with a rating of “good to excellent” to 28% from 36% a week earlier. The estimate of crops with a rating of “poor to very poor”, on the contrary, increased to 30% from 24%. Texas is the 2nd largest producer of winter wheat in the US after Kansas. Let us recall that this year, American farmers planted only 31.3 million acres of winter wheat, which is the minimum since 1909. Low prices were the main reason for this. The main negative factor for the Canadian dollar is the risk of a rate cut by the Bank of Canada. However, currently, the probability of such an event in 2019 is estimated not too high - at the level of 20%. The publication of weak statistics may force the Bank of Canada to soften monetary policy. Its rate is 1.75%, which is higher than 1.4% inflation.
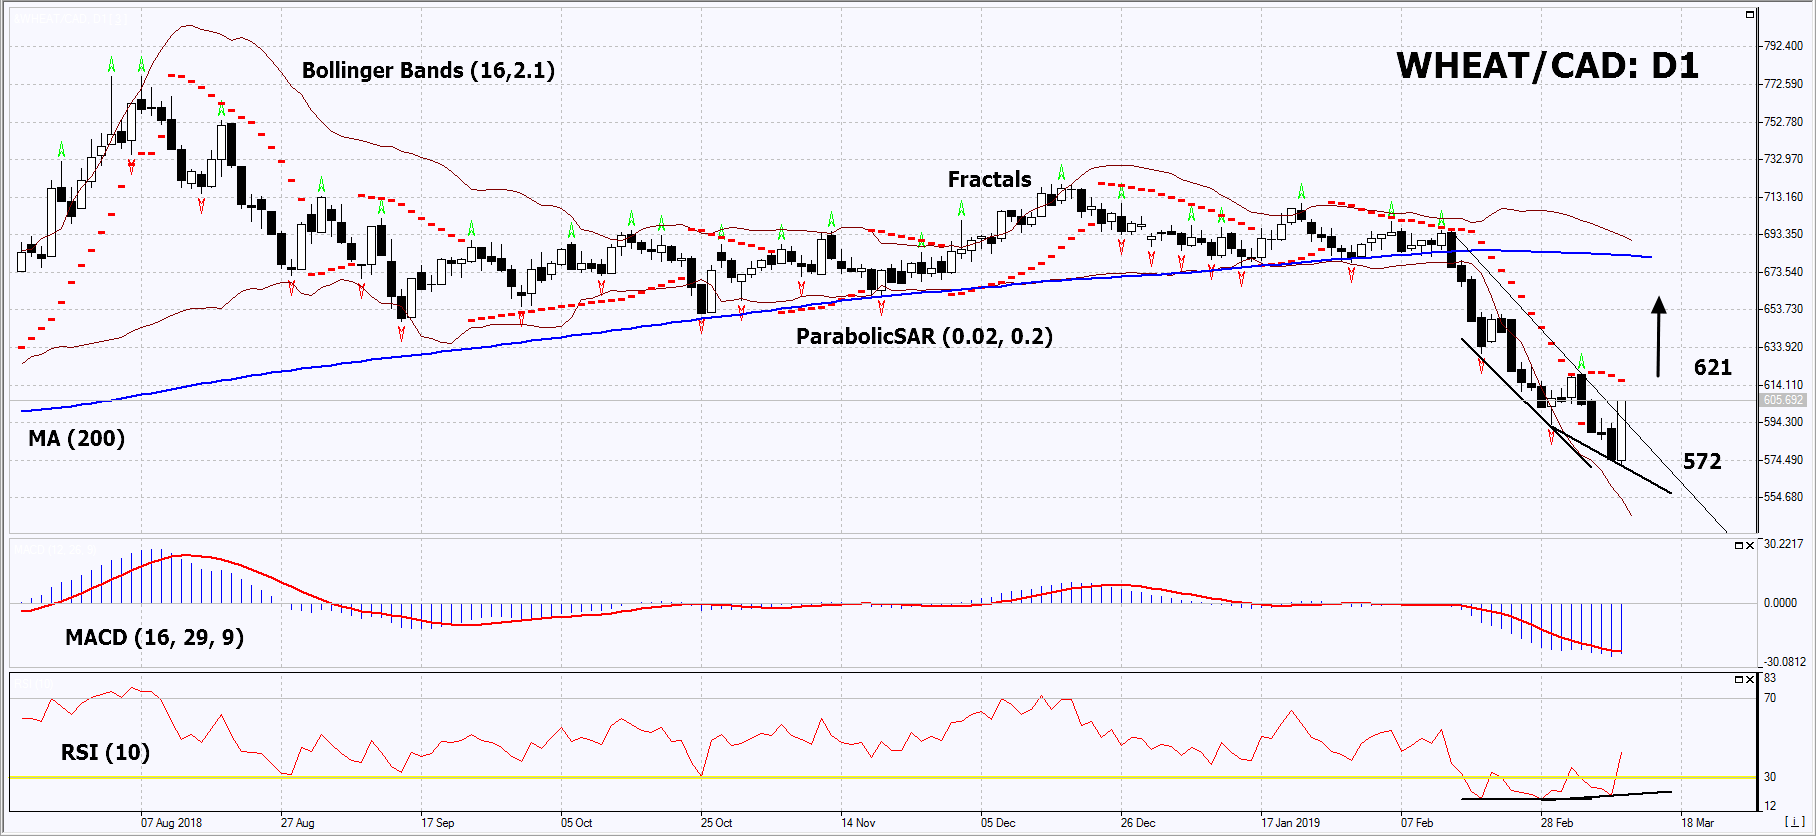
On the daily timeframe, WHEAT/CAD: D1 has breached up the resistance line of the downtrend. A number of technical analysis indicators formed buy signals. The further price increase is possible in case of a shortage of wheat.
- The Parabolic Indicator gives a bearish signal. It can be used as an additional resistance level that should be overcome before opening a buy position.
- The Bollinger bands have widened, which indicates high volatility. Both Bollinger bands are titled down.
- The RSI indicator is below 50. It has formed a positive divergence.
- The MACD indicator gives a bullish signal.
The bullish momentum may develop in case WHEAT/CAD exceeds its last fractal high and the Parabolic signal at 621.This level may serve as an entry point. The initial stop loss may be placed below the last low (since February 2018) at 572. After opening the pending order, we shall move the stop to the next fractal low following the Bollinger and Parabolic signals. Thus, we are changing the potential profit/loss to the breakeven point. More risk-averse traders may switch to the 4-hour chart after the trade and place there a stop loss moving it in the direction of the trade. If the price meets the stop level (572) without reaching the order (621), we recommend to close the position: the market sustains internal changes that were not taken into account.
Summary of technical analysis
| Position | Buy |
| Buy stop | Above 621 |
| Stop loss | Below 572 |
- コースを取って、

【重要な注意事項】:
本レポートは、当社の親会社であるアイエフシーマーケットが作成したものの邦訳です。本レポートには、当社のサービスと商品についての情報を含みますが、お客様の投資目的、財務状況、資金力にかかわらず、情報の提供のみを目的とするものであり、金融商品の勧誘、取引の推奨、売買の提案等を意図したものではありません。 本レポートは、アイエフシーマーケットが信頼できると思われる情報にもとづき作成したものですが、次の点に十分ご留意ください。アイエフシーマーケットおよび当社は、本レポートが提供する情報、分析、予測、取引戦略等の正確性、確実性、完全性、安全性等について一切の保証をしません。アイエフシーマーケットおよび当社は、本レポートを参考にした投資行動が利益を生んだり損失を回避したりすることを保証または約束あるいは言外に暗示するものではありません。アイエフシーマーケットおよび当社は、本レポートに含まれる不確実性、不正確性、不完全性、誤謬、文章上の誤り等に起因して、お客様または第三者が損害(直接的か間接的かを問いません。)を被った場合でも、一切の責任を負いません。
