- マーケット分析
- テクニカル分析
カナダドルに対する小麦 テクニカル分析 - カナダドルに対する小麦 取引:2019-08-12
Weak macro-economic data were released in Canada
In this review, we suggest considering a personal composite instrument (PCI) “Wheat against Canadian dollar”. It rises with gains in wheat price on global market and weakening of Canadian dollar. Will the WHEAT/CAD price increase?
Publication of weak macro data may be a negative factor for Canadian dollar. Unemployment rose to 5.7% in July from 5.5% in June. Employment shrank by 242000. It was worse than expected. Data indicating a decline in building permits were released earlier. Declining crude oil prices may additionally contribute to weakening of Canadian dollar. In past four weeks Brent has fallen 12%. The next Bank of Canada meeting is scheduled for September 4. The likelihood of a quarter point rate cut from current 1.75% is estimated at 23%. Wheat has been rising against the background of rising global demand and drought in US. According to the USDA the US wheat export rose 27% last week and was above 4-week average by 17%. Saudi Arabia loosened its wheat import requirements to allow purchases not only of European but also Russian wheat. And Japan Meteorology Agency said the likelihood of unfavorable weather conditions due to formation of El Nino or La Nina is 60%.
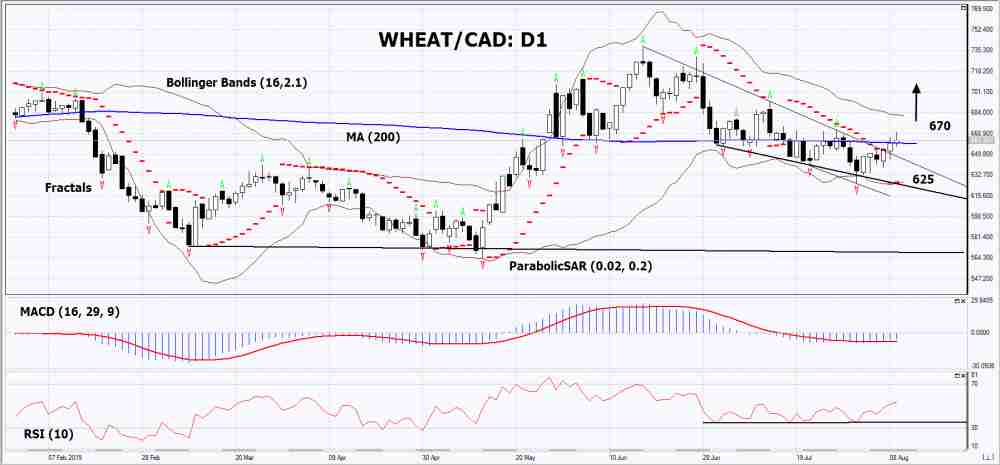
On the daily timeframe WHEAT/CAD: D1 has breached above the resistance line of the downtrend and risen above 200-day moving average MA(200). Some technical analysis indicators have formed bullish signal. Further gain in price is possible in case of wheat shaortage.
- The Parabolic indicator gives bullish signal.
- The Bollinger bands have widened, indicating a volatility increase. Both Bollinger Lines slope upward.
- The RSI indicator is above the 50 mark . It has formed a bullish divergence.
- The MACD indicator gives a bullish signal.
We don’t exclude bullish movement if WHEAT/CAD rises above last fractal high: 670. This level can be used as an entry point. The initial stop loss may be placed below the last fractal low, Bollinger lower line and Parabolic signal: 625. After opening the pending order, the stop shall be moved following the signals of Bollinger and Parabolic to the next fractal low. Thus, we are changing the potential profit/loss to the breakeven point. More risk-averse traders may switch to the 4-hour chart after the trade and place a stop loss moving it in the direction of the trade. If the price meets the stop level (625) without reaching the order (670), we recommend to cancel the order: the market sustains internal changes that were not taken into account.
Technical Analysis Summary
| Position | Buy |
| Buy stop | Above 670 |
| Stop loss | Below 625 |
- コースを取って、

【重要な注意事項】:
本レポートは、当社の親会社であるアイエフシーマーケットが作成したものの邦訳です。本レポートには、当社のサービスと商品についての情報を含みますが、お客様の投資目的、財務状況、資金力にかかわらず、情報の提供のみを目的とするものであり、金融商品の勧誘、取引の推奨、売買の提案等を意図したものではありません。 本レポートは、アイエフシーマーケットが信頼できると思われる情報にもとづき作成したものですが、次の点に十分ご留意ください。アイエフシーマーケットおよび当社は、本レポートが提供する情報、分析、予測、取引戦略等の正確性、確実性、完全性、安全性等について一切の保証をしません。アイエフシーマーケットおよび当社は、本レポートを参考にした投資行動が利益を生んだり損失を回避したりすることを保証または約束あるいは言外に暗示するものではありません。アイエフシーマーケットおよび当社は、本レポートに含まれる不確実性、不正確性、不完全性、誤謬、文章上の誤り等に起因して、お客様または第三者が損害(直接的か間接的かを問いません。)を被った場合でも、一切の責任を負いません。
