- マーケット分析
- テクニカル分析
銀 テクニカル分析 - 銀 取引:2018-01-16
Silver falls behind in growth against gold
Precious metals are increasing in price on the background of the US dollar index decrease to the 3-year low. Will the silver quotes grow?
The US currency mostly weakens against euro. Investors expect a softening of the ECB monetary policy. Note that the range of the Fed rates is currently at 1.25-1.5% with the inflation of 2.1% in annual terms. The ECB rate is zero, but the Eurozone inflation is much lower than that of the US and amounts to 0.9%. The possible growth of the ECB rate increases the attractiveness of the euro against the US dollar. Additional negative factors for the US currency are political risks in the DPRK, Iran, etc. It should be noted that silver has increased by only 3.5% in the last 12 months. It markedly lags behind gold, which has advanced by 12% in the same period. Silver reserves in the largest private investment fund iShares Silver Trust are now at a 2-year low. Theoretically, investors' interest in it may increase on the background of the general rise in precious metals’ prices.
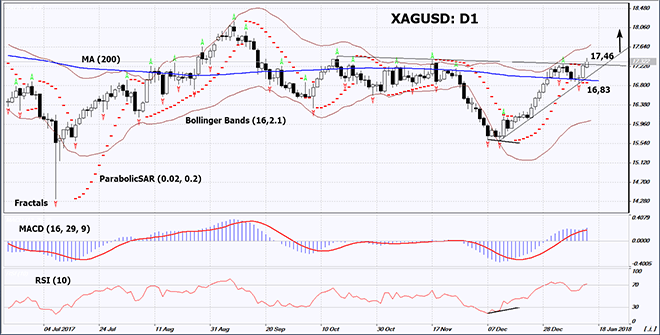
On the daily timeframe, XAGUSD: D1 is in the rising trend. During the latest correction it could not breach below the 200-day moving average line. It may become the support level for a fresh upward movement. The further price increase is possible in case of the worsening of the economic indicators in the US and the escalation of political risks.
- The Parabolic indicator gives a bullish signal.
- The Bollinger bands have widened, which means higher volatility. They are tilted upwards.
- The RSI indicator is above 50. No divergence.
- The MACD indicator gives a bullish signal.
The bullish momentum may develop in case XAGUSD exceeds the six last fractal highs at 17.46. This level may serve as an entry point. The initial stop loss may be placed below the 200-day moving average line, the Parabolic signal and the last fractal low at 16.83. After opening the pending order, we shall move the stop to the next fractal low following the Bollinger and Parabolic signals. Thus, we are changing the potential profit/loss to the breakeven point. More risk-averse traders may switch to the 4-hour chart after the trade and place there a stop loss moving it in the direction of the trade. If the price meets the stop level at 16.83 without reaching the order at 17.46, we recommend cancelling the position: the market sustains internal changes that were not taken into account.
Summary of technical analysis
| Position | Buy |
| Buy stop | above 17,46 |
| Stop loss | below 16,83 |
- コースを取って、

【重要な注意事項】:
本レポートは、当社の親会社であるアイエフシーマーケットが作成したものの邦訳です。本レポートには、当社のサービスと商品についての情報を含みますが、お客様の投資目的、財務状況、資金力にかかわらず、情報の提供のみを目的とするものであり、金融商品の勧誘、取引の推奨、売買の提案等を意図したものではありません。 本レポートは、アイエフシーマーケットが信頼できると思われる情報にもとづき作成したものですが、次の点に十分ご留意ください。アイエフシーマーケットおよび当社は、本レポートが提供する情報、分析、予測、取引戦略等の正確性、確実性、完全性、安全性等について一切の保証をしません。アイエフシーマーケットおよび当社は、本レポートを参考にした投資行動が利益を生んだり損失を回避したりすることを保証または約束あるいは言外に暗示するものではありません。アイエフシーマーケットおよび当社は、本レポートに含まれる不確実性、不正確性、不完全性、誤謬、文章上の誤り等に起因して、お客様または第三者が損害(直接的か間接的かを問いません。)を被った場合でも、一切の責任を負いません。
