- マーケット分析
- テクニカル分析
金 テクニカル分析 - 金 取引:2019-02-12
Gold prices fall amid increasing demand for dollar assets
Gold prices decrease amid the strengthening of the US dollar. As a rule, these two assets move in antiphase and are antagonists of each other. Will the XAUUSD fall?
Last week, the US dollar index showed the maximum weekly growth in six months and updated the 6-week high. Investors consider the precious metal to be a heaven asset amid slowing global economic growth and trade wars. The SPDR Gold Trust fund reported a reduction in reserves of the physical metal for five days in a row last week. Another negative factor for gold prices may be the absence of Chinese investors this week due to the celebration of the New Year according to the lunar calendar.
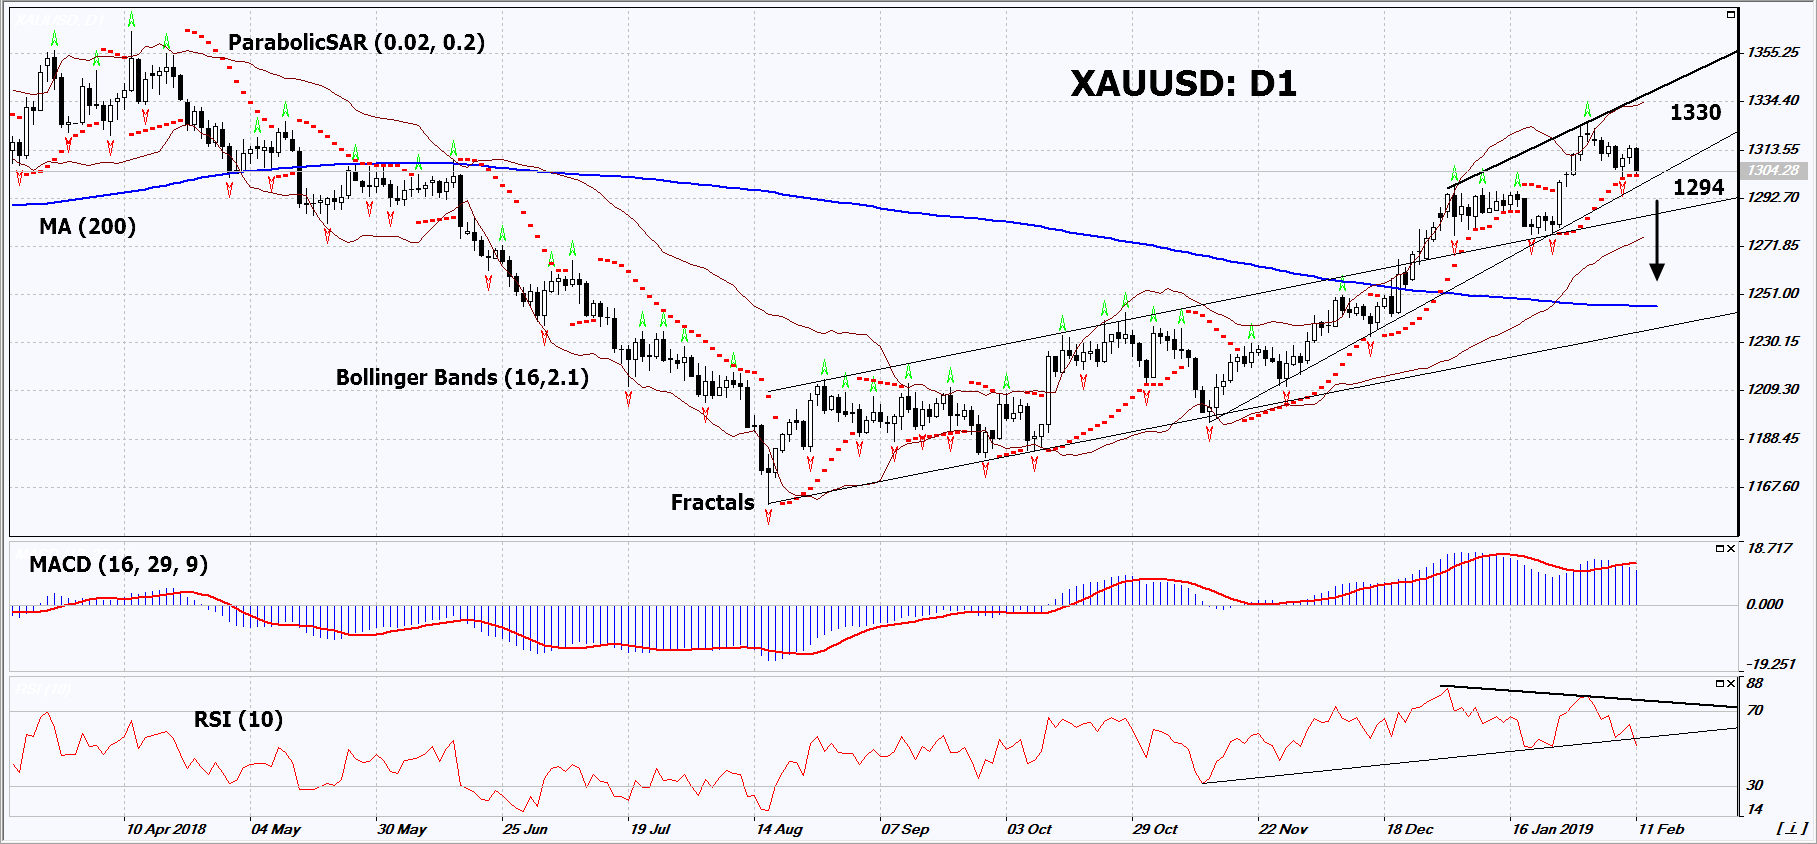
On the daily timeframe, XAUUSD: D1 is in a rising trend. However, the price increase has slowed down and a number of technical analysis indicators have formed sell signals. It is possible in case of the further strengthening of the US dollar.
- The Parabolic indicator gives a bullish signal. It can be used as an additional support level, which should be overcome before opening a sell position.
- The Bollinger bands have widened, which indicates high volatility.
- The RSI indicator is above 50. It has formed a negative divergence.
- The MACD indicator gives a bearish signal.
The bearish momentum may develop in case XAUUSD falls below the last fractal low, the Parabolic signal and the support line of the uptrend at 1294. This level may serve as an entry point. The initial stop loss may be placed above the last fractal high and the 9-month high at 1330. After opening the pending order, we shall move the stop to the next fractal low following the Bollinger and Parabolic signals. Thus, we are changing the potential profit/loss to the breakeven point. More risk-averse traders may switch to the 4-hour chart after the trade and place there a stop loss moving it in the direction of the trade. If the price meets the stop level (1330) without reaching the order (1294), we recommend to close the position: the market sustains internal changes that were not taken into account.
Summary of technical analysis
| Position | Sell |
| Sell stop | Below 1294 |
| Stop loss | Above 1330 |
- コースを取って、

【重要な注意事項】:
本レポートは、当社の親会社であるアイエフシーマーケットが作成したものの邦訳です。本レポートには、当社のサービスと商品についての情報を含みますが、お客様の投資目的、財務状況、資金力にかかわらず、情報の提供のみを目的とするものであり、金融商品の勧誘、取引の推奨、売買の提案等を意図したものではありません。 本レポートは、アイエフシーマーケットが信頼できると思われる情報にもとづき作成したものですが、次の点に十分ご留意ください。アイエフシーマーケットおよび当社は、本レポートが提供する情報、分析、予測、取引戦略等の正確性、確実性、完全性、安全性等について一切の保証をしません。アイエフシーマーケットおよび当社は、本レポートを参考にした投資行動が利益を生んだり損失を回避したりすることを保証または約束あるいは言外に暗示するものではありません。アイエフシーマーケットおよび当社は、本レポートに含まれる不確実性、不正確性、不完全性、誤謬、文章上の誤り等に起因して、お客様または第三者が損害(直接的か間接的かを問いません。)を被った場合でも、一切の責任を負いません。
