- マーケット分析
- テクニカル分析
パラジウム テクニカル分析 - パラジウム 取引:2019-07-16
Car sales are declining worldwide
Palladium quotations again approached the historical maximum. Meanwhile, the car sales worldwide is decreasing. Is XPDUSD correction possible?
Approximately 80% of global palladium consumption is accounted for by the automotive industry and the production of catalysts to reduce harmful gasoline engine emissions. Another 5% is consumed by the global chemical industry. As environmental standards tightened, the demand for autocatalysts increased and the price of palladium soared 3 times in the last 3 years. Now it has reached the psychological level of $ 1600 / ounce for the 2nd time. Meanwhile, according to the estimates of the Association of European Businesses, the Association of European Automobile Manufacturers and a number of consulting agencies, sales of automobiles in the world decreased by 7.4% in 1Q2019 compared to the same period of 2018. The data for the first half of the year may turn out to be even worse, since according to official data, the decline in car sales in China in January-May 2019 was 15.2%. Note that after 3-fold growth of palladium quotations, its consumption has decreased in the jewelry and electronics industry, in dental prosthetic and in the issue of investment coins and bars. Theoretically, it is possible to increase the dependence of quotations on the state of affairs in the global automotive industry and the chemical industry.
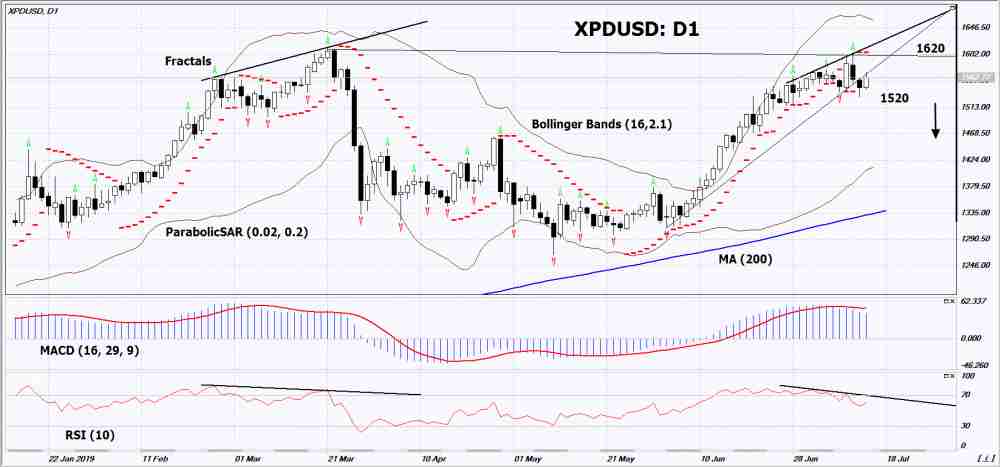
On the daily timeframe XPDUSD: D1 adjusted down from the historical maximum. It overcame the growing trend support line. Decrease in quotations is possible in the event of a decrease in global demand and a continuation of the decline in the Chinese automotive industry.
- The Parabolic indicator indicates signal to decrease.
- The Bolinger bands widened, indicating high volatility. The top line slopes down.
- The RSI indicator is above the 50 mark. It has formed a divergence to decrease.
- The MACD indicator gives bearish signal.
The bearish momentum may develop if XPDUSD will drop below its last high: 1520. This level can be used as an entry point. The initial stop lose may be placed higher than the last upper fractal, the historical maximum and the Parabolic signal: 1620. After opening the pending order, stop shall be moved following the the Bollinger and Parabolic signals to the next fractal minimum. Thus, we are changing the potential profit/loss to the breakeven point. More risk-averse traders may switch to the 4-hour chart after the trade and place a stop loss moving it in the direction of the trade. If the price meets the stop level (1520) without reaching the order (1620), we recommend to cancel the order: the market sustains internal changes that were not taken into account.
Technical Analysis Summary
| Position | Sell |
| Sell stop | Below 1520 |
| Stop loss | Above 1620 |
- コースを取って、

【重要な注意事項】:
本レポートは、当社の親会社であるアイエフシーマーケットが作成したものの邦訳です。本レポートには、当社のサービスと商品についての情報を含みますが、お客様の投資目的、財務状況、資金力にかかわらず、情報の提供のみを目的とするものであり、金融商品の勧誘、取引の推奨、売買の提案等を意図したものではありません。 本レポートは、アイエフシーマーケットが信頼できると思われる情報にもとづき作成したものですが、次の点に十分ご留意ください。アイエフシーマーケットおよび当社は、本レポートが提供する情報、分析、予測、取引戦略等の正確性、確実性、完全性、安全性等について一切の保証をしません。アイエフシーマーケットおよび当社は、本レポートを参考にした投資行動が利益を生んだり損失を回避したりすることを保証または約束あるいは言外に暗示するものではありません。アイエフシーマーケットおよび当社は、本レポートに含まれる不確実性、不正確性、不完全性、誤謬、文章上の誤り等に起因して、お客様または第三者が損害(直接的か間接的かを問いません。)を被った場合でも、一切の責任を負いません。
