- Analýza
- Technická analýza
Retrospektiva technické analýzy &XAUAUD Od 2020-11-18
Australian dollar strengthens along with yuan

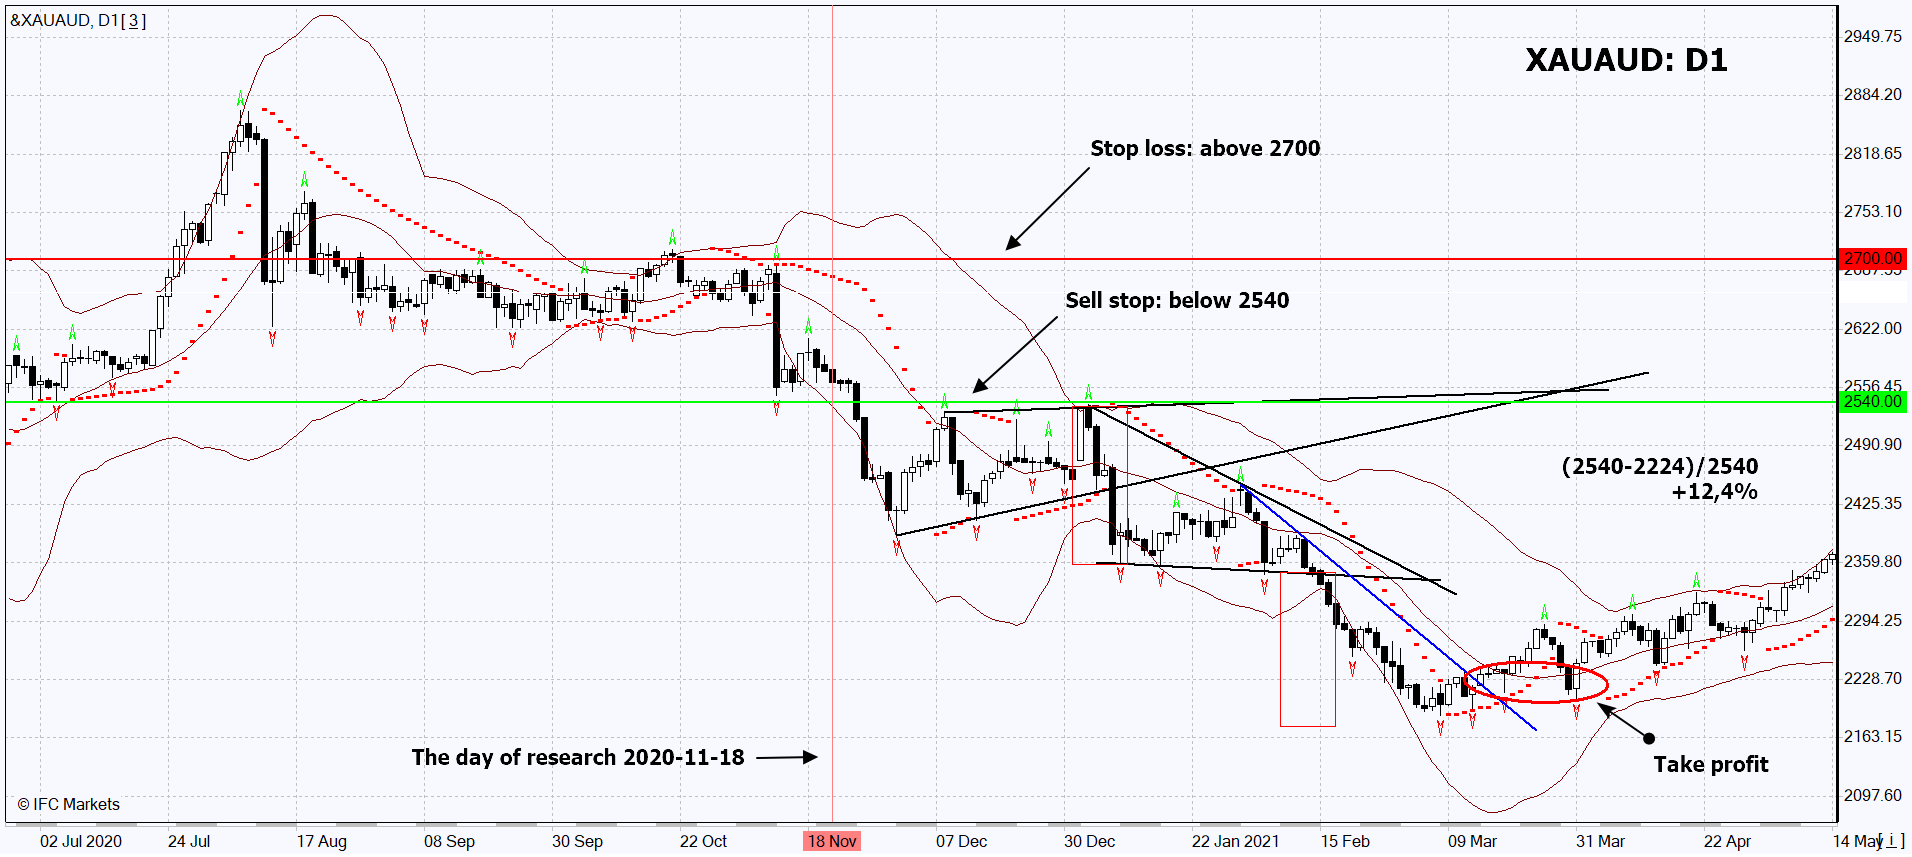
| Sell stop | 2540 |
| Take profit | 2224 |
| Return on Investment | +12,4% |
| Overview date | 2020-11-18 |
| Date of the closing position | from 2021-03-15 to 2021-03-31 |
The chart shows the real change of quotations after the publication of technical analysis on 2020-11-18. The pending order from this analysis was executed and the position was opened. Next, we shall move the stop to the next fractal low following the Bollinger Bands and Parabolic SAR signals at the 4-hour charts. Thus, we are changing the potential profit/loss to the breakeven point. The position shall be closed when the price meets the Bollinger bands, the Parabolic SAR, the trend line and the fractal indicator.
Nový exkluzivní analytický nástro
Jakýkoli časový rozsah - оd jednoho dne do jednoho roku
Jakákoli obchodní skupina - Forex, akcie, indexy, atd.
