- Analýza
- Technická analýza
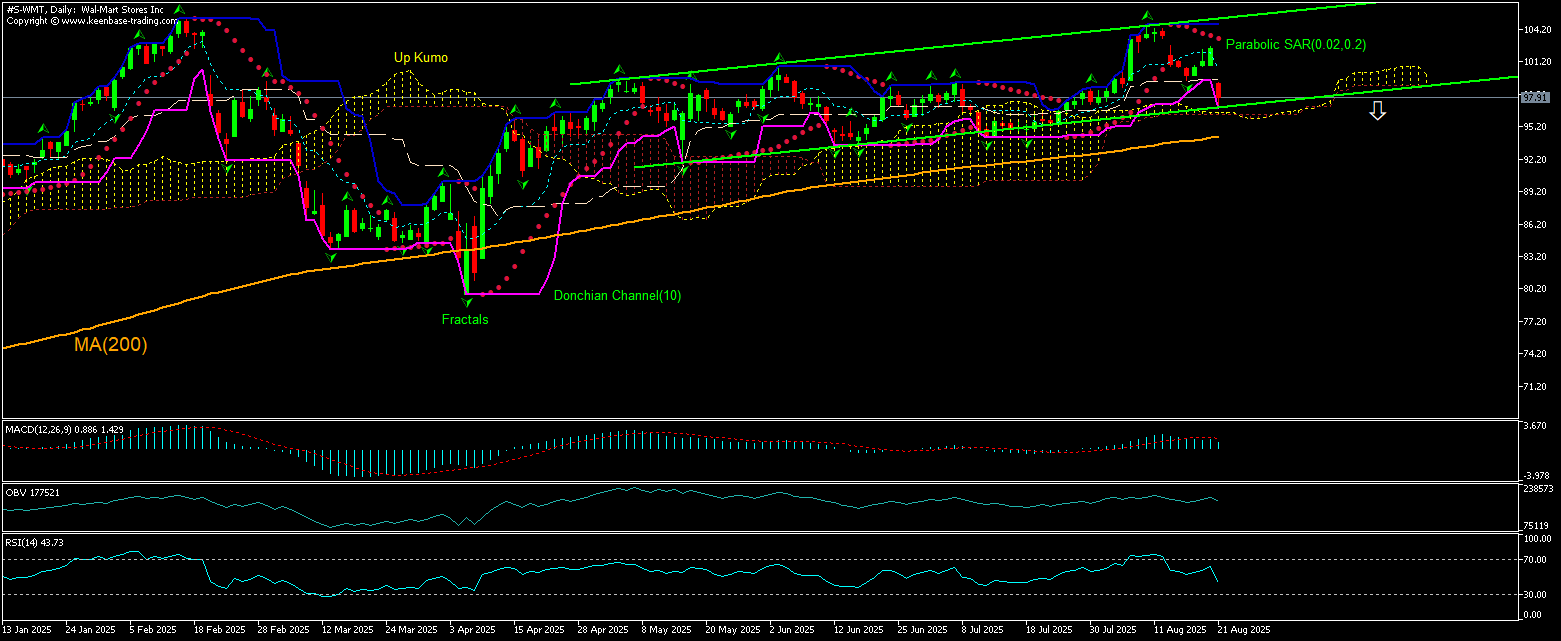
Wal-Mart Stores Technická analýza - Wal-Mart Stores Obchodování: 2025-08-22
Wal-Mart Stores Technical Analysis Summary
níže 96.35
Sell Stop
výše 103.35
Stop Loss
| Indicator | Signal |
| RSI | Neutrální |
| MACD | Sell |
| Donchian Channel | Sell |
| MA(200) | Buy |
| Fractals | Neutrální |
| Parabolic SAR | Sell |
| On Balance Volume | Sell |
| Ichimoku Kinko Hyo | Buy |
Wal-Mart Stores Chart Analysis
Wal-Mart Stores Technická analýza
The technical analysis of the Walmart stock price chart on 4-hour timeframe shows #S-WMT,H4 is retracing down toward the 200-period moving average MA(200) after hitting 6-month high 2 weeks ago. We believe the bearish momentum will resume after the price breaches below the lower Donchian bound at 97.91. A level below this can be used as an entry point for placing a pending order to sell. The stop loss can be placed at 103.35. After placing the order, the stop loss is to be moved every day to the next fractal high indicator, following Parabolic indicator signals. Thus, we are changing the expected profit/loss ratio to the breakeven point. If the price meets the stop loss level (103.35) without reaching the order (96.35), we recommend cancelling the order: the market has undergone internal changes which were not taken into account.
Fundamentální analýza Akcie - Wal-Mart Stores
Walmart stock tumbled after Q2 earnings missed Wall Street estimates. Will the Walmart stock price continue retreating?
Walmart stock fell 4.5% yesterday as earnings missed Wall Street estimates. The stock sold off despite 4.8% rise in Q2 sales to $177.4 billion which beat the consensus revenue estimate of $175.5 billion. Overall gross margins were about flat at 24.5% versus 24.4% last quarter, missing consensus estimates of 24.9%. On a constant-currency basis, revenues grew 5.6%, reflecting strong performance across all business segments. Walmart stock sold off despite reporting better results than rival Target. Walmart's comparable sales growth at stores open at least one year was 4.6% in Q2, up from 4.2% one year ago. Transactions rose 1.5%, down from 3.6% last year, while average ticket, or the amount spent per transaction, rose 3.1%, up from 0.6%. For comparison, Target reported a 1.9% comparable sales decline and an online sales growth of only 4.3% in the quarter. The retail and wholesale giant indicated the average ticket growth was partly due to inflation and passing along higher costs associated with tariffs, which increased Walmart's import costs, and the company would increase prices this summer as announced earlier to offset tariff-related costs. Walmart said it continued to see cost increases each week as inventory was replenished at post-tariff price levels and those costs will continue rising in the second half of the year. However, the company reported tariff impact wasn't as big as expected so far as Walmart has raised prices maybe 1% since the end of the first quarter. The company’s operating income decreased 8.2% year over year to $7.3 billion. The company cited tariffs as the primary challenge, as well as discrete legal and restructuring costs. Adjusted operating income is up 0.4% in current currency terms. Still, management raised its full-year guidance: sales guidance was increased to 3.75% to 4.75% growth from 3% to 4% prior forecast while operating income growth guidance was unchanged - up 3.5% to 5.5%. Higher than expected revenue growth and guidance is bullish for Walmart stock price while earnings miss is a downside risk.
Explore our
Trading Conditions
- Spreads from 0.0 pip
- 30,000+ Trading Instruments
- Stop Out Level - Only 10%
Ready to Trade?
Open Account Poznámka:
Tento přehled má informativně poznávací charakter a publikuje se zdarma. Všechny údaje, uvedené v přehledu, jsou získány z otevřených zdrojů, jsou uznávány více méně spolehlivé. Přitom, neexistují žádné garance, že uvedená informace je úplná a přesná. Přehledy se v budoucnu neobnovují. Veškerá informace v každém přehledu, včetně názorů, ukazatelů, grafů, je pouze poskytována a není finančním poradenstvím nebo doporučením. Celý text nebo jeho jakákoliv část a také grafy nelze považovat za nabídku provádět nějaké transakce s jakýmikoliv aktivy. Společnost IFC Markets a její zaměstnanci za žádných okolností nemají žádnou odpovědnost za jakékoli kroky učiněné kýmkoliv po nebo v průběhu seznámení s přehledem.

