

- Education
- Forex Technical Analysis
- Chart Patterns
- Continuation Patterns
- Pennant
Pennant Chart Pattern: Forex Chart Pattern
The pennant chart pattern is one of the most reliable continuation signals in technical analysis, helping traders spot when a strong price move is likely to resume after a brief pause. This guide breaks down its structure, bullish and bearish variations, trading tactics, and target calculation methods.
DEFINITION:
The pennant graphical price model is a minor, short-term, trend continuation pattern that shows the previous direction will prevail in the future after its formation. As for the daily chart the pattern is generally formed within a week.
Key Moments
- A pennant forms after a sharp price move, followed by a small symmetrical triangle of converging trendlines on lower volume.
- Pennants are continuation patterns, meaning the price typically resumes moving in the same direction as the initial strong move.
- Bullish pennants appear during uptrends, while bearish pennants appear during downtrends, each signaling a temporary pause before continuation.
- Traders often confirm a pennant breakout with a volume spike before entering a position in the breakout direction.
- The price target for a pennant is usually measured by projecting the length of the initial flagpole move.
What is Pennant Chart Pattern
A pennant chart pattern is a short-term continuation formation that appears after a sharp, nearly vertical price movement in either direction. This initial move, often called the flagpole, is followed by a small consolidation phase shaped like a symmetrical triangle. During this pause, trading volume typically contracts as buyers and sellers reach a temporary equilibrium before the next move.
The pattern gets its name from its visual resemblance to a small triangular flag, or pennant, attached to a pole. Two converging trendlines form the body of the pennant, narrowing as price action tightens over a period of days or weeks. This tightening reflects decreasing volatility rather than a genuine reversal in market sentiment.
Pennants are widely used across forex, stock, and commodity markets because they reflect a common psychological pause in trending markets. Traders and technical analysts view the pattern as a sign that the market is catching its breath before continuing the prior trend. Recognizing this structure early can help traders anticipate the next significant price swing.
What distinguishes a pennant from other consolidation patterns is the combination of a sharp preceding move and symmetrical, converging trendlines. Unlike rectangles, which have horizontal boundaries, a pennant's boundaries slope toward each other like a small wedge. This subtle structural difference is important when distinguishing pennants from similar continuation patterns like flags or triangles.
Is a pennant bullish or bearish
A pennant itself is neither inherently bullish nor bearish, since its direction depends entirely on the trend that preceded it. The pattern simply reflects a pause in momentum, and its eventual breakout direction typically matches the direction of the flagpole. This is why context, not the pennant shape alone, determines whether the setup favors buyers or sellers.
Analysts classify pennants into two main types based on the preceding price action and expected breakout direction. A bullish pennant forms after a strong upward move and generally resolves with continued upward momentum. A bearish pennant forms after a sharp decline and usually resolves with the downtrend resuming once consolidation ends.
Understanding this directional bias helps traders avoid misreading a pause in price as an actual reversal signal. Because pennants are continuation patterns by definition, betting against the prevailing trend inside the pattern carries higher risk. The safest approach is to treat the pennant as a temporary lull rather than a change in the underlying trend.
Bullish Pennant Pattern
A bullish pennant develops after a steep rally, when buyers briefly pause before pushing prices higher again. Price consolidates into a small symmetrical triangle while volume declines, signaling reduced selling pressure during the pause. Once the upper trendline breaks with rising volume, the uptrend often resumes with strength similar to the initial flagpole.
Traders typically look for a clean, well-defined flagpole with a strong momentum surge before trusting the bullish pennant setup. The steeper and more decisive the initial rally, the more reliable the subsequent continuation tends to be. Weak or choppy flagpoles often produce unreliable pennants that fail to continue in the expected direction.
Confirmation matters greatly when trading a bullish pennant, since false breakouts can occur in choppy market conditions. A genuine breakout is usually accompanied by a noticeable increase in trading volume above the recent average. Waiting for a candle close beyond the upper trendline helps traders avoid entering on premature or false signals.
Bearish Pennant Pattern
A bearish pennant forms after a sharp decline, as sellers briefly pause while price consolidates into a tightening triangular range. This pause reflects temporary indecision rather than genuine buying strength, since overall market sentiment remains negative during the formation. When the lower trendline breaks, the downtrend commonly resumes with momentum matching the original flagpole decline.
As with its bullish counterpart, the strength of the initial flagpole plays a major role in the pattern's reliability. A sharp, high-volume sell-off followed by a controlled consolidation phase produces the most trustworthy bearish pennant setups. Gradual or indecisive declines tend to produce weaker patterns that are more prone to failure.
Traders confirm bearish pennant breakouts by watching for a decisive close below the lower trendline on increased volume. This confirmation reduces the risk of acting on a temporary dip that fails to develop into a full continuation move. Combining volume analysis with the pattern's structure gives traders a more disciplined entry approach.
Pennant Pattern Trading
Trading a pennant pattern effectively starts with correctly identifying the flagpole and confirming the consolidation phase that follows it. Traders typically wait for a decisive breakout beyond one of the converging trendlines before entering a new position. Entering too early, before the pattern fully forms, increases the risk of getting caught in a false move.
Volume plays a central role in validating any pennant breakout, since genuine continuations are usually accompanied by rising participation. A breakout on thin volume is more likely to fail or reverse shortly after the initial move occurs. Many traders combine volume confirmation with momentum indicators like the RSI or MACD for added conviction.
Risk management remains essential, since even well-formed pennants can occasionally fail to continue as expected. Placing a stop-loss just beyond the opposite side of the pennant helps limit losses if the breakout reverses unexpectedly. Position sizing should reflect the distance between entry and stop-loss to keep risk consistent across trades.
Timeframe selection also influences how pennant patterns are traded, since shorter timeframes produce more frequent but less reliable signals. Swing traders often favor daily or four-hour charts, while intraday traders may use the pattern on lower timeframes with tighter targets. Matching the strategy to a trader's risk tolerance and time horizon improves overall consistency.
Pennant Chart Pattern Formation
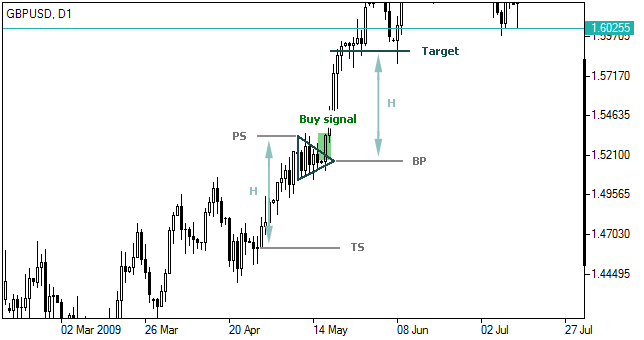
This pattern is represented by two converging trendlines, support is upward sloping and resistance is downward sloping, visually forming a triangle, which conclude price fluctuations within. The pattern is often characterized by a sharp price entering after intensive movement.

Interpretation of Pennant
This pattern confirms the trend movement direction in case of breaking through:
- a sell signal arise if the pattern is formed in a downtrend and the price falls below the support line (plus certain deviation is possible);
- a buy signal arise if the pattern is formed in an uptrend and the price rises above the resistance line (plus certain deviation is possible).
Pennant Pattern Target Price
Following a pennant pattern formation the price is generally believed to change in the same direction it was going prior to the pattern by at least the same amount as the price change from the start of the trend to the formation of the pennant. The target level is calculated as follows:
In case of a downtrend: T = BP – (TS – PS) In case of an uptrend: T = BP + (PS – TS) Where:T – target price;
BP – breakthrough point;
TS – trend start point;
PS – pattern start point.
Conclusion
The pennant chart pattern offers traders a practical way to anticipate continuation moves after periods of strong momentum. Its distinct flagpole-and-triangle structure makes it relatively easy to identify once traders understand what to look for. Both bullish and bearish variations follow the same underlying logic, differing only in the direction of the prevailing trend.
Successful pennant trading depends on patience, proper volume confirmation, and disciplined risk management around the breakout point. Rushing into a trade before the pattern completes or ignoring volume signals often leads to poor outcomes. Combining the pattern with broader trend analysis improves the odds of catching genuine continuation moves.
As with any technical formation, no pattern guarantees success, and pennants should be used alongside sound risk practices. Traders who master reading flagpole strength and breakout confirmation gain a valuable tool for trend-following strategies. Over time, this pattern can become a reliable component of a broader, well-rounded trading approach.
Forex Indicators FAQ
What is a Forex Indicator?
Forex technical analysis indicators are regularly used by traders to predict price movements in the Foreign Exchange market and thus increase the likelihood of making money in the Forex market. Forex indicators actually take into account the price and volume of a particular trading instrument for further market forecasting.
What are the Best Technical Indicators?
Technical analysis, which is often included in various trading strategies, cannot be considered separately from technical indicators. Some indicators are rarely used, while others are almost irreplaceable for many traders. We highlighted 5 the most popular technical analysis indicators: Moving average (MA), Exponential moving average (EMA), Stochastic oscillator, Bollinger bands, Moving average convergence divergence (MACD).
How to Use Technical Indicators?
Trading strategies usually require multiple technical analysis indicators to increase forecast accuracy. Lagging technical indicators show past trends, while leading indicators predict upcoming moves. When selecting trading indicators, also consider different types of charting tools, such as volume, momentum, volatility and trend indicators.
Do Indicators Work in Forex?
There are 2 types of indicators: lagging and leading. Lagging indicators base on past movements and market reversals, and are more effective when markets are trending strongly. Leading indicators try to predict the price moves and reversals in the future, they are used commonly in range trading, and since they produce many false signals, they are not suitable for trend trading.

Not sure about your Forex skills level?
Take a Test and We Will Help You With The Rest
You can see the graphical object on the price chart by downloading one of the trading terminals offered by IFC Markets.



Was this article helpful?

 You can study CFD trading more thoroughly and see CFD trading examples in the section How To Trade CFDs Visit Educational Center