

- Education
- Forex Technical Analysis
- Chart Patterns
- Reversal Patterns
- Double Top
Double Top Chart Pattern
The double top chart pattern is one of the most recognizable bearish reversal signals in technical analysis, forming after a sustained uptrend. Traders rely on it to anticipate trend exhaustion and potential downside moves. This guide explains how the pattern forms, how to identify it accurately, and how to trade it with confidence.
DEFINITION:
The double top pattern is considered a graphical price formation which precedes existing trend reversal. It is typically formed in an uptrend and is expected to be followed by a drop in prices, while the longer it takes for the pattern to be formed the more reliable it is.
Key Moments
- A double top pattern forms when price reaches a resistance level twice, failing to break higher on the second attempt.
- The pattern signals a potential bearish reversal after an extended uptrend, warning traders that upward momentum may be fading.
- Confirmation occurs when price breaks below the neckline connecting the low point between the two peaks.
- Traders often measure the distance between the peaks and the neckline to estimate a realistic target price for the move.
- Volume analysis alongside the double top pattern can strengthen or weaken the reliability of the reversal signal.
What is Double Top Pattern
A double top pattern is a bearish reversal formation that appears after a strong uptrend loses its momentum. It consists of two consecutive peaks at approximately the same price level, separated by a moderate pullback. This shape resembles the letter "M" on a price chart, making it visually easy to recognize.
The first peak forms when buyers push price to a new high before profit-taking triggers a temporary decline. A second rally then attempts to challenge the same resistance level but ultimately fails to exceed it. This failure suggests that buying pressure is weakening and sellers are beginning to gain control of the market.
The neckline, drawn along the low point between the two peaks, acts as a critical support level. A confirmed breakdown below the neckline signals that the reversal is likely underway and further declines may follow. Traders across forex, stocks, and commodities use this pattern to anticipate shifts from bullish to bearish sentiment.
Understanding the double top pattern helps traders avoid entering long positions near exhausted highs. It also provides a structured framework for planning entries, stop-loss placement, and profit targets. Because the pattern appears across multiple timeframes, it remains relevant for both short-term and long-term trading strategies.
How to Trade Double Top Pattern
Trading the double top pattern requires patience and confirmation before entering a position. Below is a step-by-step approach to help you trade this pattern effectively across different markets.
Step 1: Identify the Pattern
Look for two peaks of similar height separated by a moderate pullback on the price chart. Confirm the formation appears after a clear uptrend to ensure validity.
Step 2: Draw the Neckline
Connect the low point between the two peaks to establish the neckline, which serves as your key support level. This line will later confirm whether the reversal is genuine.
Step 3: Wait for Confirmation
Avoid acting on the pattern until price closes clearly below the neckline on a candlestick chart. Premature entries before confirmation often lead to false signals and unnecessary losses.
Step 4: Open a Trading Account
Before executing trades, open trading account with a regulated broker that offers access to your preferred instruments. This step ensures you can act quickly once the setup confirms.
Step 5: Choose Your Trading Platform
Select a platform suited to your strategy, such as MetaTrader 4, MetaTrader 5, or NetTradeX, each offering charting tools to track the pattern. These platforms allow you to set alerts for neckline breaks automatically.
Step 6: Manage Risk and Set Targets
Place a stop-loss above the second peak and calculate your target by measuring the distance from the peaks to the neckline. Consistent risk management helps protect capita if the pattern fails to play out as expected.
How to Identify Double Top Pattern
Identifying a double top pattern starts with spotting two peaks that reach nearly identical price levels. These peaks should occur after a sustained uptrend, not during a sideways or ranging market. The time gap between the two peaks can range from several days to several weeks, depending on the timeframe.
A moderate pullback between the peaks, typically 10% to 20% of the prior rally, confirms a valid structure. If the pullback is too shallow or too deep, the pattern may be less reliable as a reversal signal. Volume often declines on the second peak compared to the first, hinting at weakening buying interest.
Candlestick behavior near the second peak, such as bearish reversal candles, can add further confirmation to the setup. Traders should also watch for divergence on momentum indicators like RSI or MACD during the second peak formation. This divergence suggests that price is making a similar high while momentum is actually declining underneath.
Multiple timeframe analysis strengthens identification accuracy by confirming the pattern on both short-term and higher timeframes. Combining these signals with support and resistance analysis reduces the likelihood of misreading a temporary consolidation as a reversal. A disciplined identification process ultimately separates successful pattern trading from reactive, low-probability decisions.
Double Top Pattern Formation
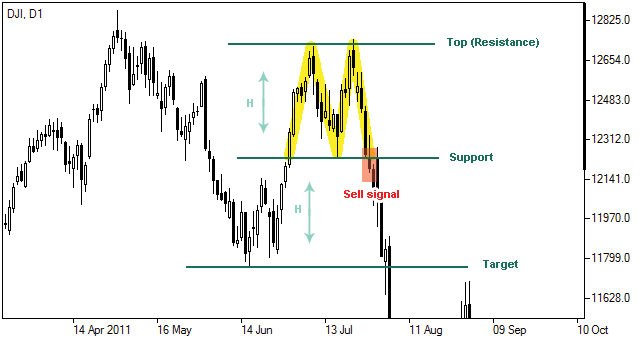
The double top pattern is characterized by two parallel horizontal lines representing support and resistance levels which respectively connect two most recent local highs of the price and a low, holding a certain bunch of price fluctuations within. The price reverses twice at resistance levels under investor consideration the asset is overpriced there.
Interpretation of Double Top Pattern
In case the market price violates the pattern’s minimum or support level (plus certain deviation is possible), the formation is considered to be completed and can be interpreted as change in direction of the trend downwards serving as a sell signal.
Double Top Pattern Target Price
Following double top pattern formation the price is generally believed to drop at least to its target level, calculated as follows:
T = S – H, Where:T – target level;
S – support level (recent local low);
H – pattern’s height (distance between support and resistance levels).
Conclusion
The double top pattern remains one of the most reliable bearish reversal signals available to technical traders. Its clear visual structure makes it accessible even for traders who are new to chart pattern analysis. Recognizing it early can help traders avoid losses and position for potential downside moves.
Successful trading of this pattern depends on patience, waiting for confirmed neckline breaks rather than anticipating them. Combining the pattern with volume analysis and momentum indicators improves the overall reliability of trading decisions. Risk management, including stop-loss placement, remains essential since no chart pattern guarantees a specific outcome.
As markets evolve, the double top pattern continues to appear across forex, stocks, indices, and commodities alike. Traders who master its identification gain a versatile tool applicable to multiple asset classes and timeframes. With consistent practice, the pattern becomes a valuable addition to any trader's technical analysis toolkit.
Forex Indicators FAQ
What is a Forex Indicator?
Forex technical analysis indicators are regularly used by traders to predict price movements in the Foreign Exchange market and thus increase the likelihood of making money in the Forex market. Forex indicators actually take into account the price and volume of a particular trading instrument for further market forecasting.
What are the Best Technical Indicators?
Technical analysis, which is often included in various trading strategies, cannot be considered separately from technical indicators. Some indicators are rarely used, while others are almost irreplaceable for many traders. We highlighted 5 the most popular technical analysis indicators: Moving average (MA), Exponential moving average (EMA), Stochastic oscillator, Bollinger bands, Moving average convergence divergence (MACD).
How to Use Technical Indicators?
Trading strategies usually require multiple technical analysis indicators to increase forecast accuracy. Lagging technical indicators show past trends, while leading indicators predict upcoming moves. When selecting trading indicators, also consider different types of charting tools, such as volume, momentum, volatility and trend indicators.
Do Indicators Work in Forex?
There are 2 types of indicators: lagging and leading. Lagging indicators base on past movements and market reversals, and are more effective when markets are trending strongly. Leading indicators try to predict the price moves and reversals in the future, they are used commonly in range trading, and since they produce many false signals, they are not suitable for trend trading.

Not sure about your Forex skills level?
Take a Test and We Will Help You With The Rest
You can see the graphical object on the price chart by downloading one of the trading terminals offered by IFC Markets.



Was this article helpful?

 You can study CFD trading more thoroughly and see CFD trading examples in the section How To Trade CFDs Visit Educational Center