

- Education
- Forex Technical Analysis
- Chart Patterns
- Reversal Patterns
- Inverse Head and Shoulders
Inverse Head and Shoulders
Spotting a trend reversal before the crowd can be the difference between missing a move and riding it from the start. The Inverse Head and Shoulders pattern is one of the most trusted bullish reversal signals in technical analysis. This guide breaks down how the pattern forms, what it signals, and how to trade it confidently on MetaTrader 4 or MetaTrader 5.
DEFINITION:
The inverse head and shoulders graphical price pattern serves as a sign of trend reversal and is expected to be followed by change in direction of the asset’s price. It is typically formed in a developed downtrend.
Key Moments
- The Inverse Head and Shoulders pattern signals a potential reversal from a bearish trend into a new bullish trend.
- The pattern consists of three troughs, with the middle trough, called the head, deeper than the two outer shoulders.
- A neckline connecting the peaks between the troughs acts as a key resistance level that confirms the pattern once broken.
- Traders often watch trading volume for confirmation, looking for a noticeable increase during the breakout above the neckline.
- The measured target price is calculated by projecting the distance from the head to the neckline upward from the breakout point.
What is an Inverse Head and Shoulders Pattern
An Inverse Head and Shoulders pattern is a bullish reversal formation that appears at the bottom of a downtrend. It consists of three distinct troughs, where the middle trough sits noticeably lower than the two surrounding troughs. This structure visually resembles an upside-down head with two shoulders, giving the pattern its recognizable name.
The pattern forms as selling pressure gradually weakens and buyers begin stepping in at progressively higher price levels. The left shoulder appears first, followed by a sharper decline that creates the head, then a shallower decline forms the right shoulder. Connecting the two peaks between these troughs creates the neckline, a critical level traders watch closely.
Confirmation of the pattern occurs only when price breaks decisively above the neckline, ideally accompanied by rising volume. Many traders wait for a retest of the neckline as former resistance turns into support before entering a position. This cautious approach helps filter out false breakouts that can occur in volatile forex markets.
This pattern appears widely across forex, commodities, and equity markets because it reflects a common psychological shift among participants. Understanding how to identify it accurately gives traders an edge in spotting potential reversals before they fully develop. Combining it with other technical indicators can further improve the reliability of trading signals.
How to Trade Inverse Head and Shoulders
Trading the Inverse Head and Shoulders pattern effectively requires patience, confirmation, and a clear risk management plan. Below is a step-by-step approach to help you identify, confirm, and trade this pattern using platforms like MetaTrader 4 and MetaTrader 5.
1. Open a Trading Account
Before you can trade the Inverse Head and Shoulders pattern, you need to open a trading account with a regulated forex broker. Choose an account type that matches your experience level and risk tolerance, then fund it to start trading.
2. Identify the Pattern on Your Chart
Use MetaTrader 4 or MetaTrader 5 to scan price charts for three consecutive troughs, with the middle one lower than the other two. Confirm that the formation appears after a clear downtrend, since context matters as much as shape.
3. Draw the Neckline
Connect the two peaks between the shoulders and the head to draw the neckline, which often slopes slightly upward or downward. This line becomes your key reference point for confirming a breakout.
4. Wait for Neckline Breakout Confirmation
Avoid entering a trade until price closes decisively above the neckline, ideally with increased trading volume supporting the move. Premature entries before confirmation increase the risk of falling into a false breakout trap.
5. Set Entry, Stop-Loss, and Target Price
Enter your position after confirmation, placing a stop-loss below the right shoulder to limit potential losses if the breakout fails. Calculate your target price by measuring the distance from the head to the neckline and projecting it upward.
6. Monitor and Manage the Trade
Track the trade's progress on MetaTrader 4 or MetaTrader 5, adjusting your stop-loss to lock in profits as price moves favorably. Stay disciplined and avoid closing the position too early out of impatience or fear.
Inverse Head and Shoulders Formation
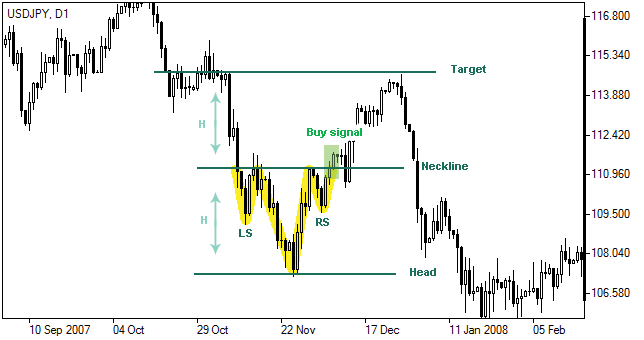
The pattern is characterized by three consecutive lows of the market price located at different levels: two higher bottoms (shoulders) aside and one lowest bottom (head) in between. There is also a neckline (resistance) connecting pattern’s highs.
Interpretation of Inverse Head and Shoulders
When the pattern is formed and the price climbs above the neckline or resistance level (plus a certain deviation is possible), investors get a buy signal. The expectation is that the rally will continue, although prices may rebound to the neckline, considered now a support, but generally stop around it.
Inverse Head and Shoulders Target Price
Following inverse head and shoulders pattern formation the price is generally believed to rise at least to its target level, calculated as follows:
T = N + (N – H), Where:T – target level;
N – neckline level (initial resistance);
H – pattern’s head level (lowest bottom).
Conclusion
The Inverse Head and Shoulders pattern remains one of the most dependable bullish reversal signals available to forex traders today. Recognizing its three-trough structure and neckline breakout helps you anticipate trend reversals with greater confidence. Mastering this pattern adds a valuable tool to any trader's technical analysis toolkit.
Success with this pattern depends on patience, waiting for confirmed breakouts rather than acting on early or incomplete formations. Combining the pattern with volume analysis and other indicators further strengthens the reliability of your trading decisions. Risk management through stop-loss placement remains essential regardless of how confident you feel about a setup.
Whether you trade on MetaTrader 4 or MetaTrader 5, practicing pattern recognition on historical charts builds the skill needed for live trading. Over time, this pattern becomes easier to spot, helping you react quickly when genuine opportunities appear. Continued education and practice remain the best path toward consistent trading results.
Forex Indicators FAQ
What is a Forex Indicator?
Forex technical analysis indicators are regularly used by traders to predict price movements in the Foreign Exchange market and thus increase the likelihood of making money in the Forex market. Forex indicators actually take into account the price and volume of a particular trading instrument for further market forecasting.
What are the Best Technical Indicators?
Technical analysis, which is often included in various trading strategies, cannot be considered separately from technical indicators. Some indicators are rarely used, while others are almost irreplaceable for many traders. We highlighted 5 the most popular technical analysis indicators: Moving average (MA), Exponential moving average (EMA), Stochastic oscillator, Bollinger bands, Moving average convergence divergence (MACD).
How to Use Technical Indicators?
Trading strategies usually require multiple technical analysis indicators to increase forecast accuracy. Lagging technical indicators show past trends, while leading indicators predict upcoming moves. When selecting trading indicators, also consider different types of charting tools, such as volume, momentum, volatility and trend indicators.
Do Indicators Work in Forex?
There are 2 types of indicators: lagging and leading. Lagging indicators base on past movements and market reversals, and are more effective when markets are trending strongly. Leading indicators try to predict the price moves and reversals in the future, they are used commonly in range trading, and since they produce many false signals, they are not suitable for trend trading.

Not sure about your Forex skills level?
Take a Test and We Will Help You With The Rest
You can see the graphical object on the price chart by downloading one of the trading terminals offered by IFC Markets.



Was this article helpful?

 You can study CFD trading more thoroughly and see CFD trading examples in the section How To Trade CFDs Visit Educational Center