

Wedge Chart Pattern - Wedge Pattern Forex
The wedge chart pattern is one of the most reliable trend reversal and continuation signals available to forex and CFD traders today. Recognizing its converging trendlines early can help traders anticipate breakouts before they happen. This guide covers what a wedge pattern is, its main types, how it forms, and practical steps for trading it confidently.
DEFINITION:
The wedge graphical price model is a minor, short-term, trend continuation pattern that shows the previous direction will prevail in the future after its formation. As for the daily chart the pattern is generally formed within a week.
Key Moments
- A wedge pattern forms when price action moves between two converging trendlines that slope in the same direction over time.
- Rising wedges typically appear during uptrends and often signal a bearish reversal once price breaks below the lower trendline.
- Falling wedges usually develop during downtrends and tend to indicate a bullish reversal once price breaks above the upper trendline.
- Trading volume generally contracts as the wedge narrows, then expands sharply once the breakout finally occurs in either direction.
- Traders often confirm wedge breakouts using additional tools such as volume analysis, momentum oscillators, or moving averages before entering a position.
What is Wedge Chart Pattern
A wedge chart pattern is a technical analysis formation created by two converging trendlines that connect a series of price highs and lows. Unlike triangles, both trendlines in a wedge slope in the same direction, either upward or downward, instead of diverging or remaining flat. This shared directional slope sets wedges apart from other consolidation patterns and offers traders early clues about the likely breakout direction.
As the pattern develops, the distance between the upper and lower trendlines gradually narrows, reflecting decreasing volatility and indecision among market participants. Price swings become smaller and tighter as buyers and sellers approach a temporary equilibrium within the shrinking range. This compression phase often precedes a sharp, decisive move once one of the trendlines is broken.
Wedges can appear on any timeframe and across virtually any tradable instrument, including currency pairs, indices, commodities, and individual stocks. Because the pattern reflects underlying shifts in supply and demand, it tends to recur consistently regardless of the specific market being analyzed. Understanding its structure gives traders a repeatable framework for anticipating potential reversals or continuations.
Types of Wedge Pattern
There are two primary types of wedge patterns, classified by the direction of their converging trendlines relative to the prevailing trend. A rising wedge slopes upward and typically forms during an uptrend, often signaling that upward momentum is weakening. A falling wedge slopes downward and usually develops during a downtrend, frequently hinting at fading selling pressure.
Rising wedges are generally considered bearish, since the narrowing price action suggests buyers are struggling to sustain higher highs with conviction. When price eventually breaks below the lower trendline, it often confirms that sellers have regained control of the market. This breakout can lead to a swift decline as trapped long positions are unwound.
Falling wedges are generally considered bullish, as the tightening range shows selling pressure gradually losing steam despite lower lows being printed. A breakout above the upper trendline frequently marks the point where buyers step back in with renewed strength. Both wedge types can also appear as continuation patterns, depending on where they form within the broader trend.
How to Trade Wedge Pattern
Trading a wedge pattern effectively requires patience, since the setup only becomes actionable once the breakout is confirmed with meaningful price and volume. Jumping in before the trendline is decisively broken can expose traders to false signals and premature entries. The steps below outline a practical approach to identifying and trading wedge patterns.
1. Identify the wedge on the chart
Look for at least two touchpoints on each trendline to confirm a valid, converging wedge structure. The tighter and more consistent the touches, the more reliable the pattern tends to be.
2. Confirm the trend direction
Check whether the wedge is rising or falling and note the broader trend it is forming within. This helps determine whether you are likely looking at a reversal or a continuation setup.
3. Wait for a confirmed breakout
Avoid entering until price closes clearly beyond the trendline, ideally accompanied by a noticeable increase in trading volume. Early entries before confirmation carry a higher risk of failure.
4. Open a trading account and select your platform
To act on the breakout, open a trading account and choose between MetaTrader 4 or MetaTrader 5 depending on your trading style. Both platforms offer the charting tools needed to track wedge formations in real time.
5. Set your entry, stop-loss, and target levels
Place your entry just beyond the breakout point, with a stop-loss positioned on the opposite side of the wedge. Calculate your target using the height of the wedge's widest section as a projection guide.
6. Manage the trade as it develops
Monitor volume and momentum after entry to ensure the breakout is sustaining rather than reversing back into the range. Adjust your stop-loss to lock in gains as price moves favorably in your direction.
Wedge Chart Pattern Formation
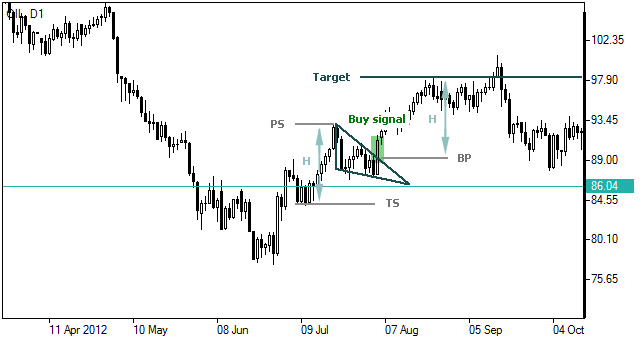
This pattern is represented by two converging trendlines, support and resistance, visually forming a triangle, which conclude price fluctuations within. Both trendlines are either upward sloping (in a downtrend) or downward sloping (in an uptrend) against the direction of the main trend. The pattern is often characterized by a sharp price entering after intensive movement.
Interpretation of Wedge Chart Pattern
This pattern confirms the trend movement direction in case of breaking through:
- a sell signal arises if the pattern is formed in a downtrend and the price falls below the support line (plus certain deviation is possible);
- a buy signal arises if the pattern is formed in an uptrend and the price rises above the resistance line (plus certain deviation is possible).
Wedge Chart Pattern Target
Following a wedge pattern formation the price is generally believed to change in the same direction it was going prior to the pattern by at least the same amount as the price change from the start of the trend to the formation of the wedge. The target level is calculated as follows:
In case of a downtrend: T = BP – (TS – PS) In case of an uptrend: T = BP + (PS – TS) Where:T – target price;
BP – breakthrough point;
TS – trend start point;
PS – pattern start point.
Conclusion
The wedge chart pattern remains a valuable tool for traders seeking early warning signs of potential reversals or continuations across any market. Its converging trendlines and narrowing price action offer a visual cue that momentum is shifting before the actual breakout occurs. Recognizing rising and falling wedges accurately can meaningfully improve the timing of trade entries.
As with any technical pattern, wedges perform best when combined with confirming signals like volume, momentum indicators, or support and resistance levels. No single pattern guarantees success, so disciplined risk management remains essential regardless of how clear the setup appears. Practicing wedge identification on historical charts can help build the confidence needed to trade it live.
Forex Indicators FAQ
What is a Forex Indicator?
Forex technical analysis indicators are regularly used by traders to predict price movements in the Foreign Exchange market and thus increase the likelihood of making money in the Forex market. Forex indicators actually take into account the price and volume of a particular trading instrument for further market forecasting.
What are the Best Technical Indicators?
Technical analysis, which is often included in various trading strategies, cannot be considered separately from technical indicators. Some indicators are rarely used, while others are almost irreplaceable for many traders. We highlighted 5 the most popular technical analysis indicators: Moving average (MA), Exponential moving average (EMA), Stochastic oscillator, Bollinger bands, Moving average convergence divergence (MACD).
How to Use Technical Indicators?
Trading strategies usually require multiple technical analysis indicators to increase forecast accuracy. Lagging technical indicators show past trends, while leading indicators predict upcoming moves. When selecting trading indicators, also consider different types of charting tools, such as volume, momentum, volatility and trend indicators.
Do Indicators Work in Forex?
There are 2 types of indicators: lagging and leading. Lagging indicators base on past movements and market reversals, and are more effective when markets are trending strongly. Leading indicators try to predict the price moves and reversals in the future, they are used commonly in range trading, and since they produce many false signals, they are not suitable for trend trading.

Not sure about your Forex skills level?
Take a Test and We Will Help You With The Rest
You can see the graphical object on the price chart by downloading one of the trading terminals offered by IFC Markets.



Was this article helpful?

 You can study CFD trading more thoroughly and see CFD trading examples in the section How To Trade CFDs Visit Educational Center