- Analytics
- Market Data
- Commodity Live Prices
- Soybean Price Chart
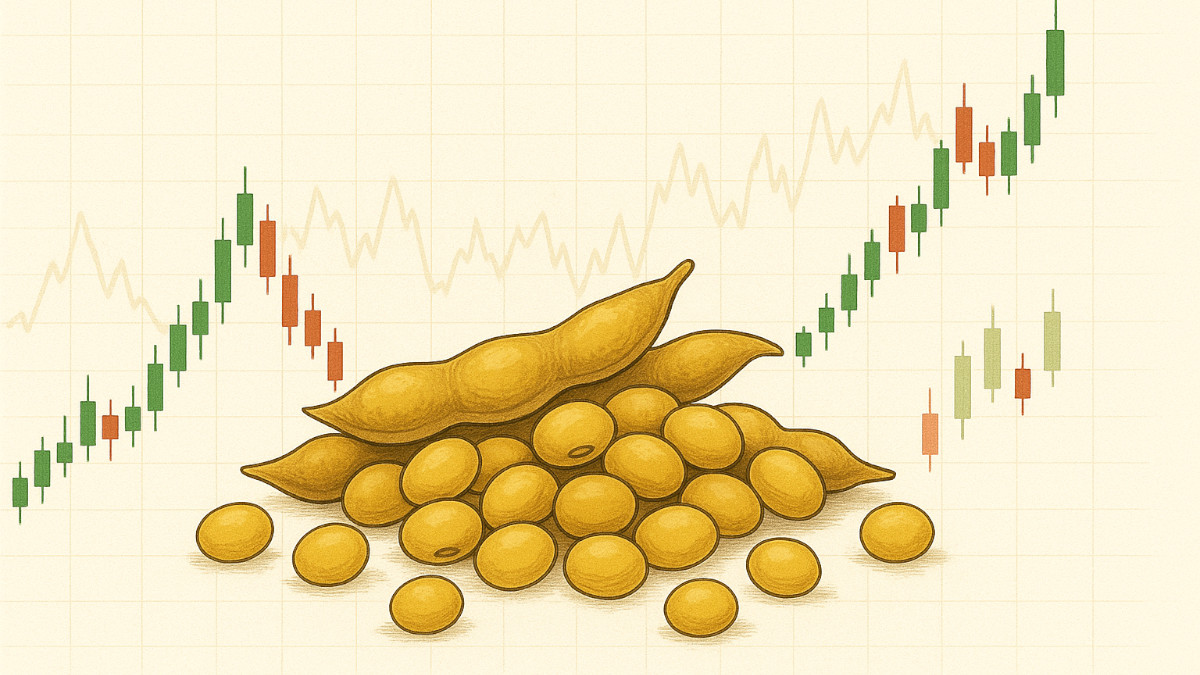
Soybean Prices Today - Soybean Price Chart
The Soybean price today is $1228.2000. On this page you can find complete information about Soybean, including the current price and its change on the live chart, which can be viewed across 8 different time frames.
Soybean Price

Soybean Live Chart
- 1m
- 5m
- 15m
- 30m
- 1h
- 4h
- 1d
- 1w
FAQs
What is Soybean price today?
As of Jul 22, Soybean futures are trading at approximately $1228.2000.
What are the main factors affecting the price of Soybean?
Soybean prices are primarily driven by seasonal planting and harvest cycles — typically planted from April to June and harvested starting in November — which create predictable supply patterns. Additional key factors include global demand (particularly from major importers like China), weather conditions in growing regions such as the US Midwest and South America, US Department of Agriculture crop reports, competing crop economics (such as corn), and broader trade policy or tariff developments affecting agricultural exports.
What chart time frames are available for Soybean analysis?
The Soybean live chart at IFC Markets is available across 8 time frames: 1m, 5m, 15m, 30m, 1h, 4h, 1d, and 1w — supporting both intraday trading and longer-term trend analysis.
How is the Soybean price quoted?
At IFC Markets, the Soybean CFD (#C-SOYB) is quoted in US dollars per 100 bushels. One contract corresponds to 100 bushels, and one standard lot contains 80 contracts (8,000 bushels). For reference, 1 US bushel equals 35.2391 litres.
Technical Analysis
Technical analysis is a method of studying and evaluating market dynamics based on the price history. Its main purpose is to forecast price dynamics of a financial instrument in future through technical analysis tools. Technical analysts use this method of market analysis to forecast the prices of different currencies and currency pairs. This type of the analysis will allow you to make market forecast based on studying historical prices of the trading instruments.
See also latest technical analysis of the price dynamics of #C_SOYB Dollar: SOYB forecast.
Soybean Trade News
Soybeans Price Analysis - Trends and Drivers
Soybeans have experienced significant price fluctuations over...