- تجزیه و تحلیل
- تحلیل تکنیکی
گذشته نگر تحلیل تکنیکی XAUUSD از 2016-12-29
کاهش محدودیت در هر معامله از سوی بورس طلای شانگهای

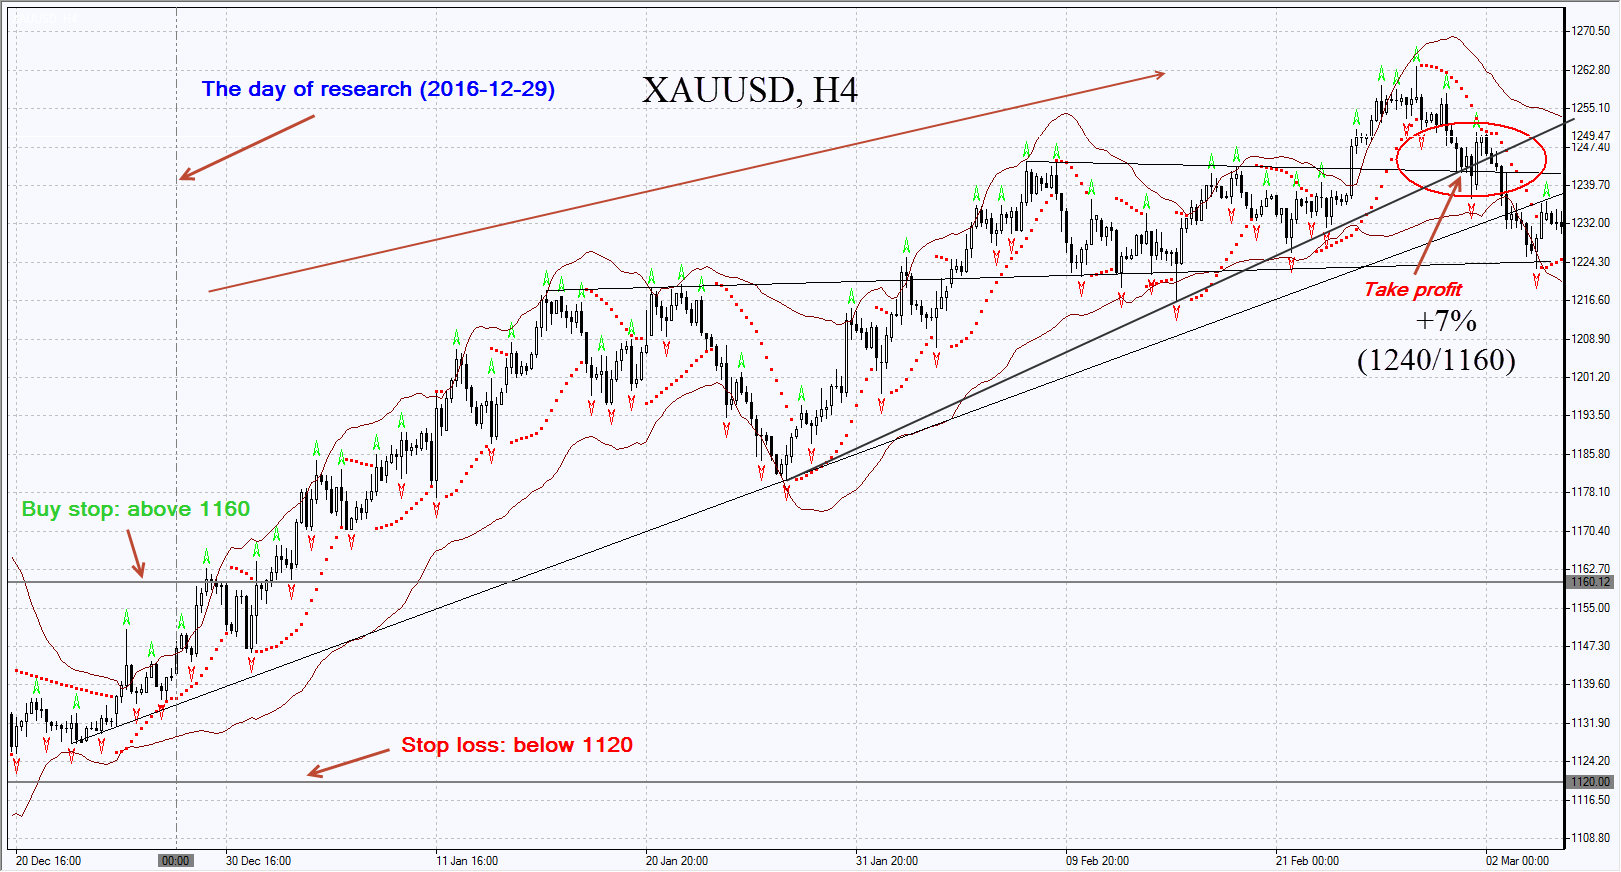
The chart shows the real change of quotations after the publication of technical analysis on 2016-11-21. The pending order from this analysis was executed and the position was opened. Next, we shall move the stop to the next fractal low following the Bollinger Bands and Parabolic SAR signals at the 4-hour charts. Thus, we are changing the potential profit/loss to the breakeven point. The position shall be closed when the price meets the Bollinger bands, the Parabolic SAR, the trend line and the fractal indicator.
| Buy stop | above 1160 |
| Take profit | 1240 |
| Return on Investment | +7% |
| Overview date | 2016-12-29 |
| Date of the closing position | 2017-01-03 |
این نمودار تغییر واقعی نرخ ها پس از انتشار تحلیل تکنیکی در 2016-11-21 را نشان می دهد. دستو2016-12-29نتظار این تحلیل اجرا و معامله باز شد. سپس ما باید در نمودار چهار ساعته توقف ضرر را به سمت کف فراکتال بعدی به دنبال خطوط بولینگر و علائم Paraboloc SAR حرکت دهیم. بنابراین ما در حال تغییر سود/زیان بالقوه به نقطۀ تراز بین سود و زیان هستیم. هنگامی که قیمت به خطوط بولینگر، Parabolic SAR، خط روند و شاخص فراکتال برسد باید معامله را بست.
ابزار تحلیلی انحصاری جدید
هر محدودۀ زمانی - از 1 روز تا 1 سال
هر گروه معاملاتی - فارکس، سهام، شاخص و غیره.