- Analýza
- Technická analýza
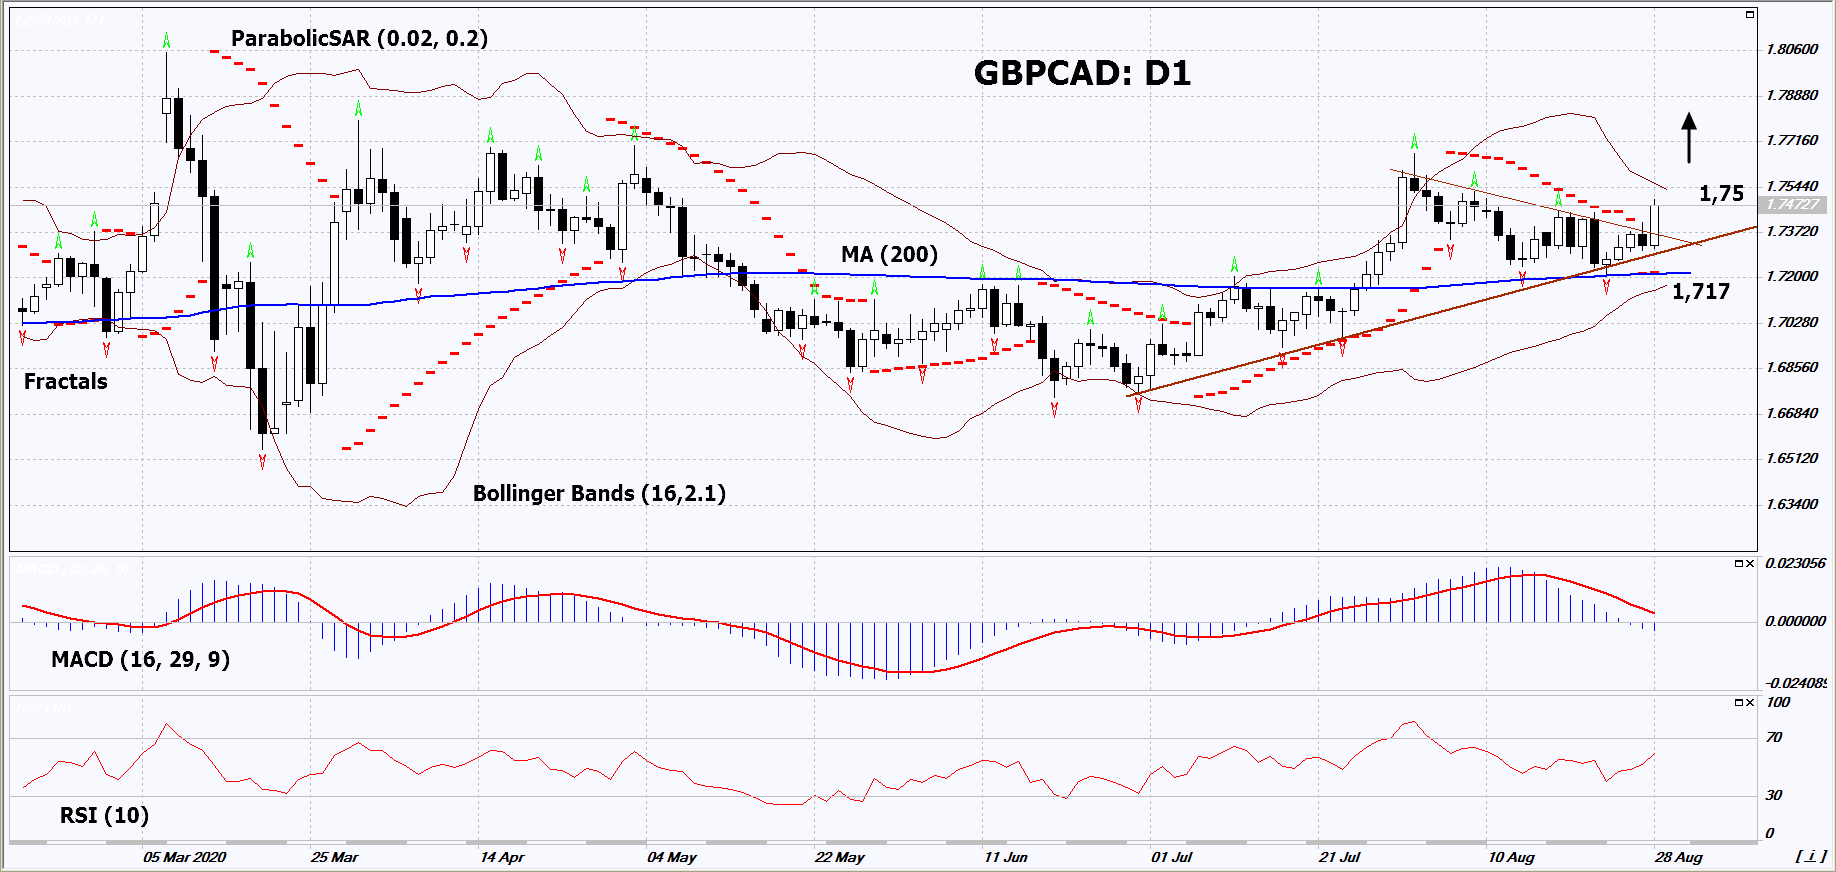
GBP/CAD Technická analýza - GBP/CAD Obchodování: 2020-08-31
GBP/CAD Technical Analysis Summary
výše 1,75
Buy Stop
níže 1,717
Stop Loss
| Indicator | Signal |
| RSI | Neutrální |
| MACD | Sell |
| MA(200) | Buy |
| Fractals | Buy |
| Parabolic SAR | Buy |
| Bollinger Bands | Neutrální |
GBP/CAD Chart Analysis
GBP/CAD Technická analýza
On the daily timeframe, GBPCAD: D1 approached the uptrend support line. It could not break it down and continues to grow. A number of technical analysis indicators generated signals for further growth. We do not rule out a bullish move if GBPCAD rises above its latest high: 1.75. This level can be used as an entry point. We can place a stop loss below the Parabolic signal, the last lower fractal, the lower Bollinger line and the 200-day moving average line: 1.717. After opening a pending order, we should move the stop loss following the Bollinger and Parabolic signals to the next fractal low. Thus, we change the potential profit/loss ratio in our favor. After the transaction, the most risk-averse traders can switch to the four-hour chart and set a stop-loss, moving it in the direction of the bias. If the price meets the stop loss (1.717) without activating the order (1.75), it is recommended to delete the order: some internal changes in the market have not been taken into account.
Fundamentální analýza Forex - GBP/CAD
In this review, we propose to consider the British pound vs. the Canadian dollar. Is the growth of GBPCAD quotes possible? Such dynamics is observed with the weakening of the Canadian dollar and the strengthening of the British pound.
British GDP fell 21.7% at an annual rate in the second quarter. Canadian GDP contracted significantly more - by 38.7%. Overall, Britain’s economy fell less and is recovering more actively than Canada’s. In June, UK GDP grew by 8.7%, and Canadian - by 6.5%. Note that the possible success of the Brexit negotiations is a positive factor for the pound, while for the Canadian dollar, there is a risk factor in the possible correction of world oil prices that have been traded in a narrow range over a month
Explore our
Trading Conditions
- Spreads from 0.0 pip
- 30,000+ Trading Instruments
- Stop Out Level - Only 10%
Ready to Trade?
Open Account Poznámka:
Tento přehled má informativně poznávací charakter a publikuje se zdarma. Všechny údaje, uvedené v přehledu, jsou získány z otevřených zdrojů, jsou uznávány více méně spolehlivé. Přitom, neexistují žádné garance, že uvedená informace je úplná a přesná. Přehledy se v budoucnu neobnovují. Veškerá informace v každém přehledu, včetně názorů, ukazatelů, grafů, je pouze poskytována a není finančním poradenstvím nebo doporučením. Celý text nebo jeho jakákoliv část a také grafy nelze považovat za nabídku provádět nějaké transakce s jakýmikoliv aktivy. Společnost IFC Markets a její zaměstnanci za žádných okolností nemají žádnou odpovědnost za jakékoli kroky učiněné kýmkoliv po nebo v průběhu seznámení s přehledem.

