- Analýza
- Technická analýza
GBP/CHF Technická analýza - GBP/CHF Obchodování: 2019-07-03
Getting ready for the publication of statistics
Weak macroeconomic statistics was published in Switzerland. The British authorities are going to take measures to stimulate the economy. Wil the GBPCHF quotations grow?
Such a movement is observed when the British pound strengthens against the Swiss franc. Manufacturing PMI Industrial Business Index in Switzerland dropped in June to 47.7 points, which is the lowest since September 2015. Retail sales in May fell by 1.7% in annual terms. They are showing a continuous decline since last October. Swiss National Bank confirmed its determination to maintain a negative interest rate (-0.75%). The Bank of England is also concerned about signs of a slowdown in the already British economy. At the same time, along with the usual rate cut, it is considering options for economic incentives through tax cuts and government spending. It can support the pound. Note that the rate of the Bank of England is positive and is + 0.75%. On Thursday, July 4, significant inflation data for June will be released in Switzerland. In the UK, an important block of statistics will be published next week.
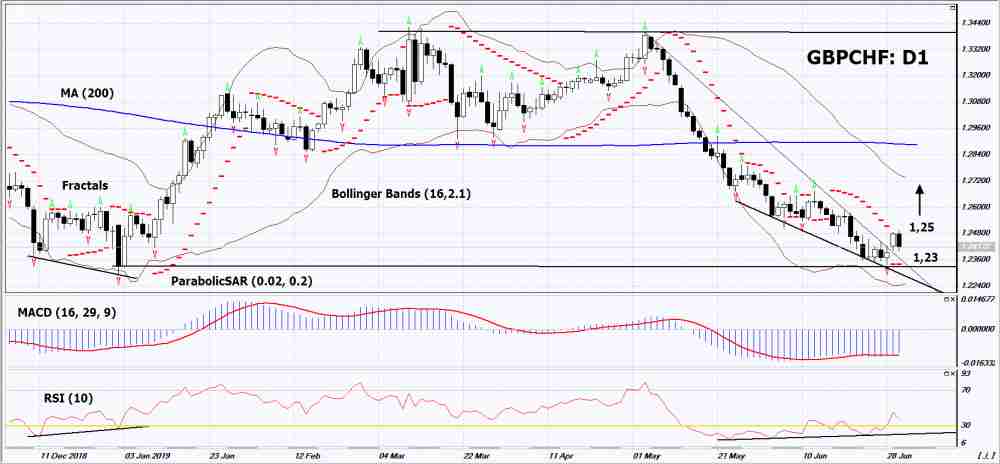
On the daily timeframe GBPCHF: D1 has reached the bottom of a wide, long-term neutral range, has pulled out of a downtrend and is trying to adjust upwards. Various technical analysis indicators have generated an uptrend signals. Further growth of quotations is possible in case of publication of positive macroeconomic indicators in the UK and negative ones in Switzerland.
- The Parabolic indicator indicates an uptrend signal.
- The Bolinger bands widened, indicating high volatility. Both lines of Bollinger have a slope up.
- The RSI indicator is above the 50 mark. It has formed a divergence to increase.
- The MACD indicator gives a bullish signal.
The bullish momentum may develop if GBPCHF exceeds its last maximum: 1.25. This level can be used as an entry point. The initial stop lose may be placed below the last lower fractal and the Parabolic signal: 1.23. After placing the pending order, the stop loss shall be moved following the signals of Bollinger and Parabolic to the next fractal minimum.Thus, we are changing the potential profit/loss to the breakeven point. More risk-averse traders may switch to the 4-hour chart after the trade and place a stop loss moving it in the direction of the trade. If the price meets the stop level (1,23) without reaching the order (1,25), we recommend to cancel the order: the market sustains internal changes that were not taken into account.
Technical Analysis Summary
| Position | Buy |
| Buy stop | Above 1,25 |
| Stop loss | Below 1,23 |
- Získejte Certifikát

Poznámka:
Tento přehled má informativně poznávací charakter a publikuje se zdarma. Všechny údaje, uvedené v přehledu, jsou získány z otevřených zdrojů, jsou uznávány více méně spolehlivé. Přitom, neexistují žádné garance, že uvedená informace je úplná a přesná. Přehledy se v budoucnu neobnovují. Veškerá informace v každém přehledu, včetně názorů, ukazatelů, grafů, je pouze poskytována a není finančním poradenstvím nebo doporučením. Celý text nebo jeho jakákoliv část a také grafy nelze považovat za nabídku provádět nějaké transakce s jakýmikoliv aktivy. Společnost IFC Markets a její zaměstnanci za žádných okolností nemají žádnou odpovědnost za jakékoli kroky učiněné kýmkoliv po nebo v průběhu seznámení s přehledem.
