- Analýza
- Technická analýza
Sójové boby Technická analýza - Sójové boby Obchodování: 2021-05-20
Sója Technical Analysis Summary
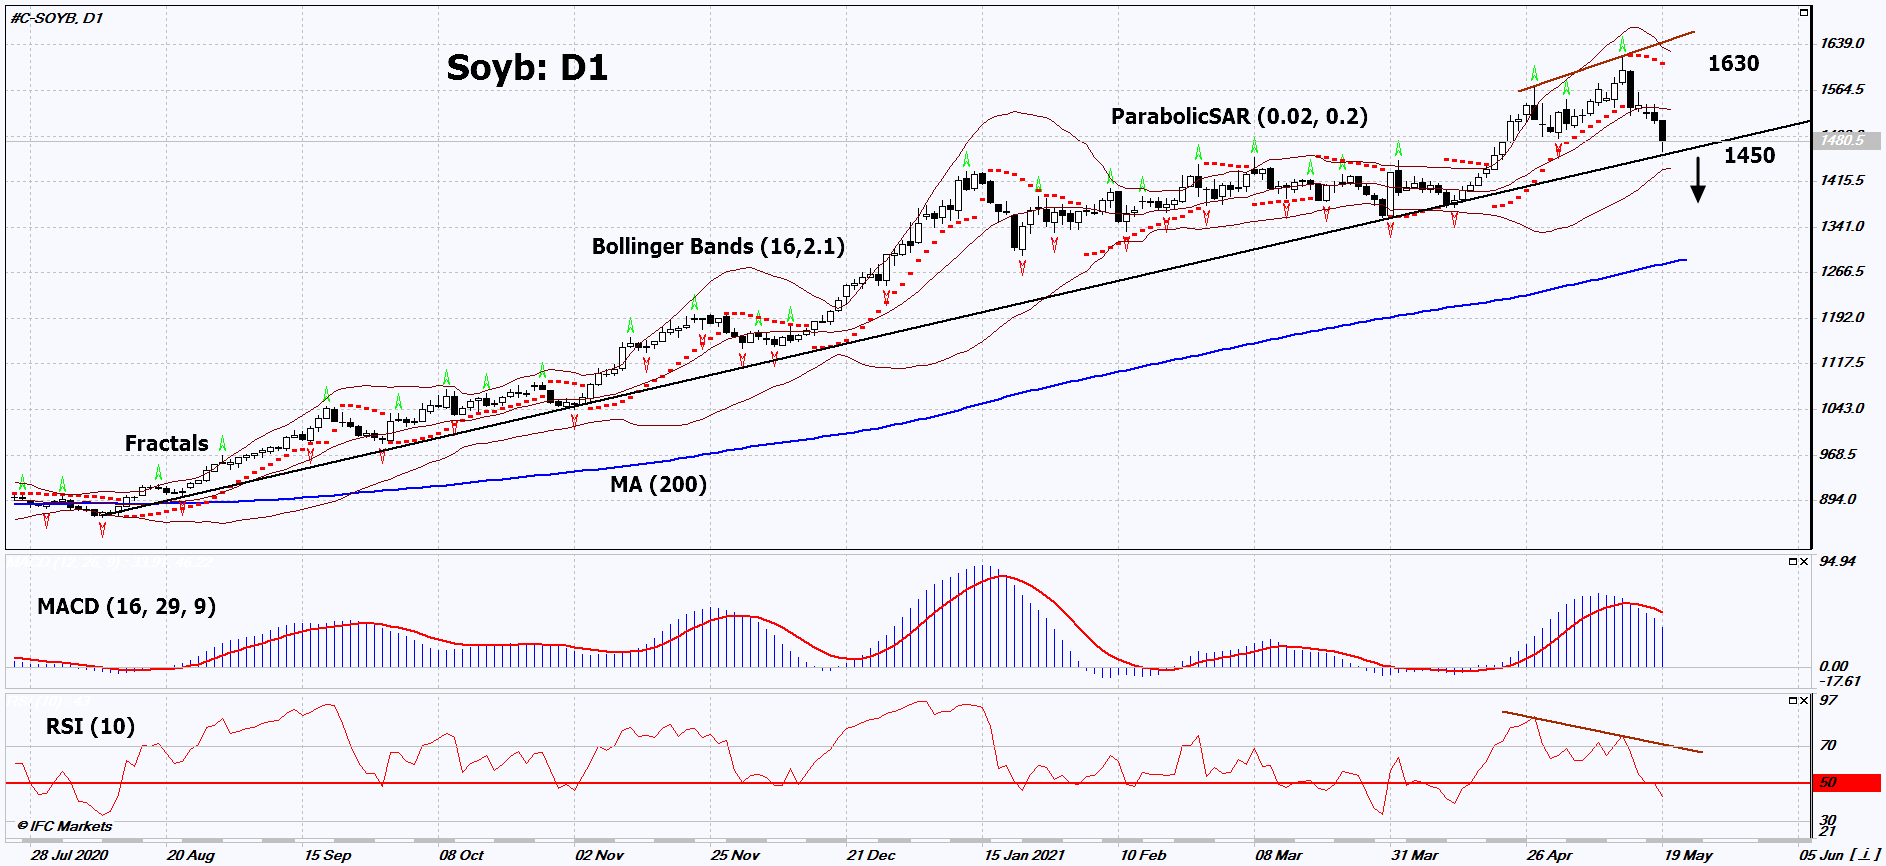
níže 1450
Sell Stop
výše 1630
Stop Loss
| Indicator | Signal |
| RSI | Sell |
| MACD | Sell |
| MA(200) | Neutrální |
| Fractals | Neutrální |
| Parabolic SAR | Sell |
| Bollinger Bands | Neutrální |
Sója Chart Analysis
Sója Technická analýza
On the daily timeframe, Soyb: D1 approached the uptrend support line. It must fall down before opening a position. A number of technical analysis indicators have formed signals for further decline. We do not rule out a bearish movement if Soyb: D1 falls below the last lower fractal and the uptrend support line: 1450. This level can be used as an entry point. The initial risk limitation is possible above the maximum since July 2013, the upper Bollinger band and the Parabolic signal: 1630. After opening the pending order, we can move the stop-loss following the Bollinger and Parabolic signals to the next fractal maximum. Thus, we change the potential profit / loss ratio in our favor. After the transaction, the most cautious traders can switch to the four-hour chart and set a stop-loss, moving it in the direction of the trend. If the price overcomes the stop-loss (1630) without activating the order (1450), it is recommended to delete the order: there are internal changes in the market that were not taken into account.
Fundamentální analýza Komodity - Sója
Rains in Brazil and the U.S. may increase soybean yields. Will the decline in Soyb quotes continue?
Rainfalls in Brazil may further increase the soybean crop. In the meantime, it is expected that it will reach a record of 144 million tons. Rains are also expected in southern part of the United States. Earlier, the U.S. The Department of Agriculture (USDA) reported a 5.4% increase in the U.S. soybean yields in 2021 compared to 2020, to 87.6 million acres. IHS Markit Agribusiness estimates the cultivated area to be larger, about 88.5 million acres. According to the USDA, this year the U.S. soybean crop is expected to increase by 270 million bushels to 4.4 billion bushels. The USDA predicts an increase in the global soybean crop by 22.6 million tons to 385.5 million tons. The American National Oilseed Processors Association (NOPA) reported that the U.S. processing of soybeans into soybean oil in April was the minimum in 19 months and amounted to 160.3 million bushels. This is much less than expected (168.7 million bushels), as well as the March indicator of 171.7 million bushels. Possibly, the reduction in soybean processing indicates a decrease in demand.
Explore our
Trading Conditions
- Spreads from 0.0 pip
- 30,000+ Trading Instruments
- Stop Out Level - Only 10%
Ready to Trade?
Open Account Poznámka:
Tento přehled má informativně poznávací charakter a publikuje se zdarma. Všechny údaje, uvedené v přehledu, jsou získány z otevřených zdrojů, jsou uznávány více méně spolehlivé. Přitom, neexistují žádné garance, že uvedená informace je úplná a přesná. Přehledy se v budoucnu neobnovují. Veškerá informace v každém přehledu, včetně názorů, ukazatelů, grafů, je pouze poskytována a není finančním poradenstvím nebo doporučením. Celý text nebo jeho jakákoliv část a také grafy nelze považovat za nabídku provádět nějaké transakce s jakýmikoliv aktivy. Společnost IFC Markets a její zaměstnanci za žádných okolností nemají žádnou odpovědnost za jakékoli kroky učiněné kýmkoliv po nebo v průběhu seznámení s přehledem.

