- تجزیه و تحلیل
- تحلیل تکنیکی
گذشته نگر تحلیل تکنیکی #C-RICE از 2016-09-06
هوا روی قیمت برنج تاثیر می گذارد

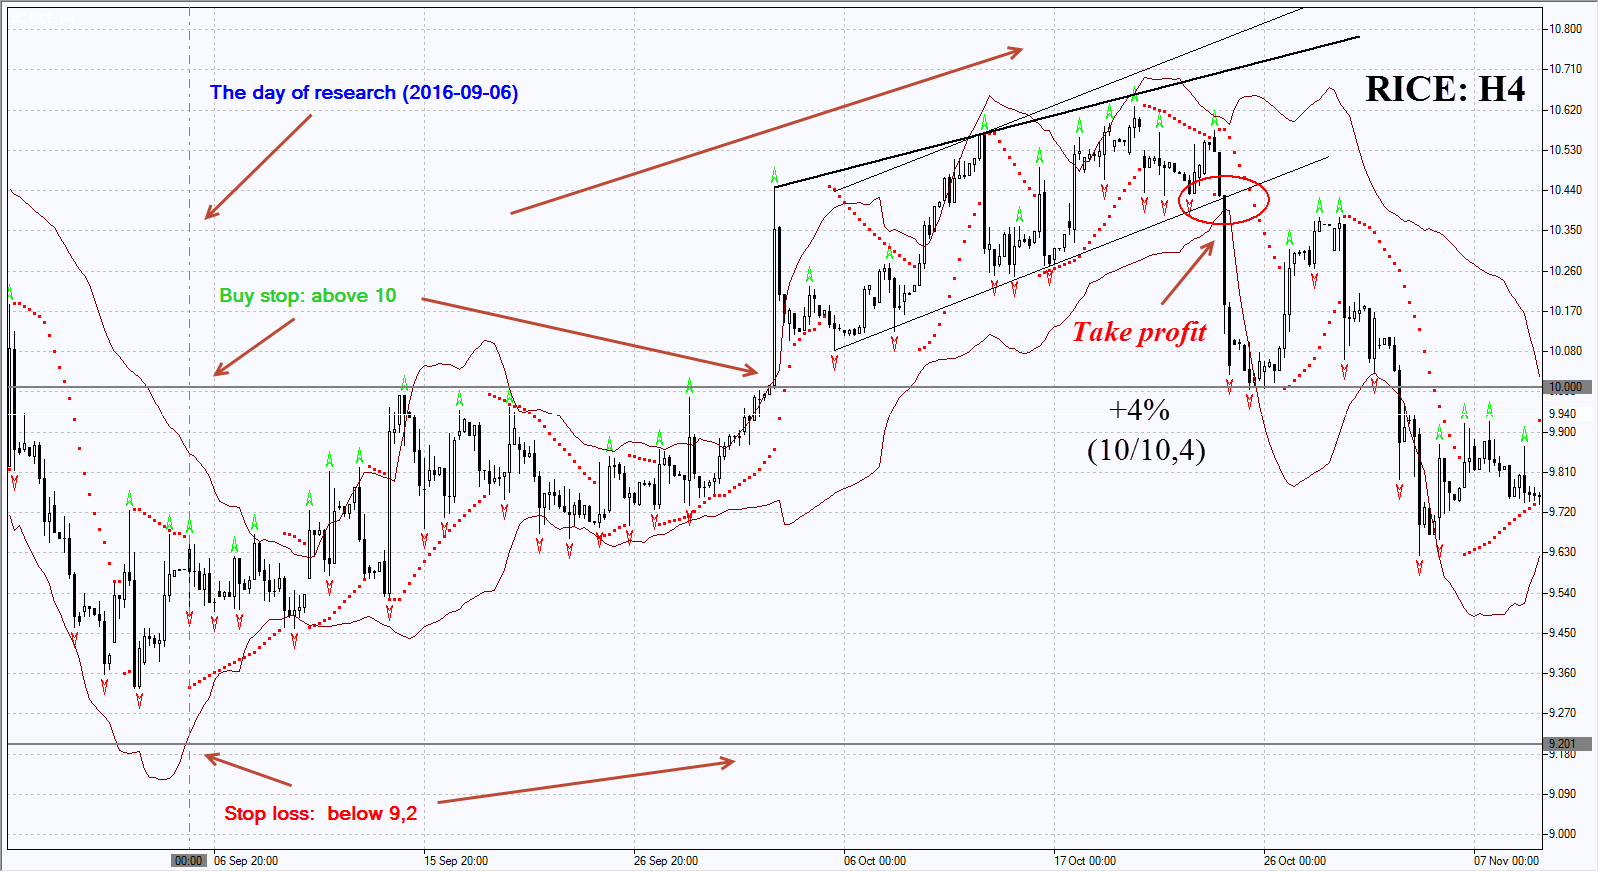
The real price change is depicted on the chart after the techical analysis was released on 2016-09-06. The position was opened with a pending order from the analysis. Then we move the stop following the Bollinger lines and the Parabolic SAR indicators in the 4-hour chart (H4) thus changing the potential profit/loss ratio. The position shall be closed with profit by any of the signals: when the price meets the respective border of Bollinger Bands, Parabolic SAR indications, trend line or the Fractal.
| Buy stop | above 10 |
| Take profit | 10.4 |
| Return on Invetment | +4% |
| Date of Review | 2016-09-06 |
| Date of closing position | 2017-10-24 |
این نمودار تغییر واقعی نرخ ها پس از انتشار تحلیل تکنیکی در 2016-11-21 را نشان می دهد. دستو2016-09-06نتظار این تحلیل اجرا و معامله باز شد. سپس ما باید در نمودار چهار ساعته توقف ضرر را به سمت کف فراکتال بعدی به دنبال خطوط بولینگر و علائم Paraboloc SAR حرکت دهیم. بنابراین ما در حال تغییر سود/زیان بالقوه به نقطۀ تراز بین سود و زیان هستیم. هنگامی که قیمت به خطوط بولینگر، Parabolic SAR، خط روند و شاخص فراکتال برسد باید معامله را بست.
ابزار تحلیلی انحصاری جدید
هر محدودۀ زمانی - از 1 روز تا 1 سال
هر گروه معاملاتی - فارکس، سهام، شاخص و غیره.

