- Analytics
- Technical Analysis
Australian Stock Index Technical Analysis - Australian Stock Index Trading: 2018-10-11
Technical indicators bearish for AU200
The Australian stock market index fell below its 200-day moving average while recent economic data were mixed. Will the AU200 decline continue?
The Reserve Bank of Australia left the interest rate at 1.5% at its October 2 meeting. Recent economic data were mixed: the balance of trade surplus rose to Australian $1.61 billion from A$1.55 billion in August, expansion in services sector accelerated and retail sales edged up 0.3% in August. At the same time activities in construction sector shrank in September as decline in building permits and new home sales continued in August. At the same time the AU200 breached and closed below the 200-day moving average MA(200). Other technical indicators are also mostly bearish. Bearish technical indicators forecast downtrend for AU200.
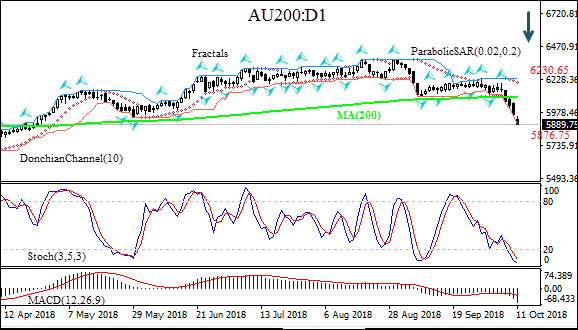
On the daily timeframe AU200: D1 has fallen below the 200-day moving average MA(200).
- The Parabolic indicator has formed a sell signal.
- The Donchian channel indicates downtrend: it is widening down.
- The MACD indicator is below the signal line with the gap widening. This is a bearish signal.
- The stochastic oscillator has breached into the oversold zone, this is bullish.
We believe the bearish momentum will continue after the price breaches below lower Donchian boundary at 5876.75. This level can be used as an entry point for placing a pending order to sell. The stop loss can be placed below the upper Donchian channel at 6230.65. After placing the pending order the stop loss is to be moved every day to the next fractal high, following Parabolic signals. Thus, we are changing the probable profit/loss ratio to the breakeven point. If the price meets the stop-loss level (6230.65) without reaching the order (5876.75) we recommend cancelling the order: the market sustains internal changes which were not taken into account.
Technical Analysis Summary
| Position | Sell |
| Sell Stop | Below 5876.75 |
| Stop loss | Above 6230.65 |
Explore our
Trading Conditions
- Spreads from 0.0 pip
- 30,000+ Trading Instruments
- Stop Out Level - Only 10%
Ready to Trade?
Open Account Note:
This overview has an informative and tutorial character and is published for free. All the data, included in the overview, are received from public sources, recognized as more or less reliable. Moreover, there is no guarantee that the indicated information is full and precise. Overviews are not updated. The whole information in each overview, including opinion, indicators, charts and anything else, is provided only for familiarization purposes and is not financial advice or а recommendation. The whole text and its any part, as well as the charts cannot be considered as an offer to make a deal with any asset. IFC Markets and its employees under any circumstances are not liable for any action taken by someone else during or after reading the overview.
