- Analytics
- Technical Analysis
EUR USD Technical Analysis - EUR USD Trading: 2017-03-01
US GDP rose in 2nd reading less than expected
US GDP for Q4 2016 remained unchanged in 2nd reading being +1.9%. Investors expected it to increase to +2.1%. Will the EURUSD continue advancing on such data?
The Q4 GDP in 2nd reading in Eurozone will be released on March 7, 2017. It may be better than its 1st reading of 1,7%. The positive economic data together with lower political risks in France may support euro. Recent polls suggest that the National Front leader Marine Le Pen will suffer a defeat at presidential elections in France. Now its rating is lower than the one of the two other candidates. Marine Le Pen opts for holding a referendum on France’s exit from EU. This week several significant economic indicators will come out in EU, including the February inflation and the January unemployment rate (on Thursday). But the main driver for EURUSD may be the reaction on Trump’s speech on Tuesday and the Fed chair speech on Friday.
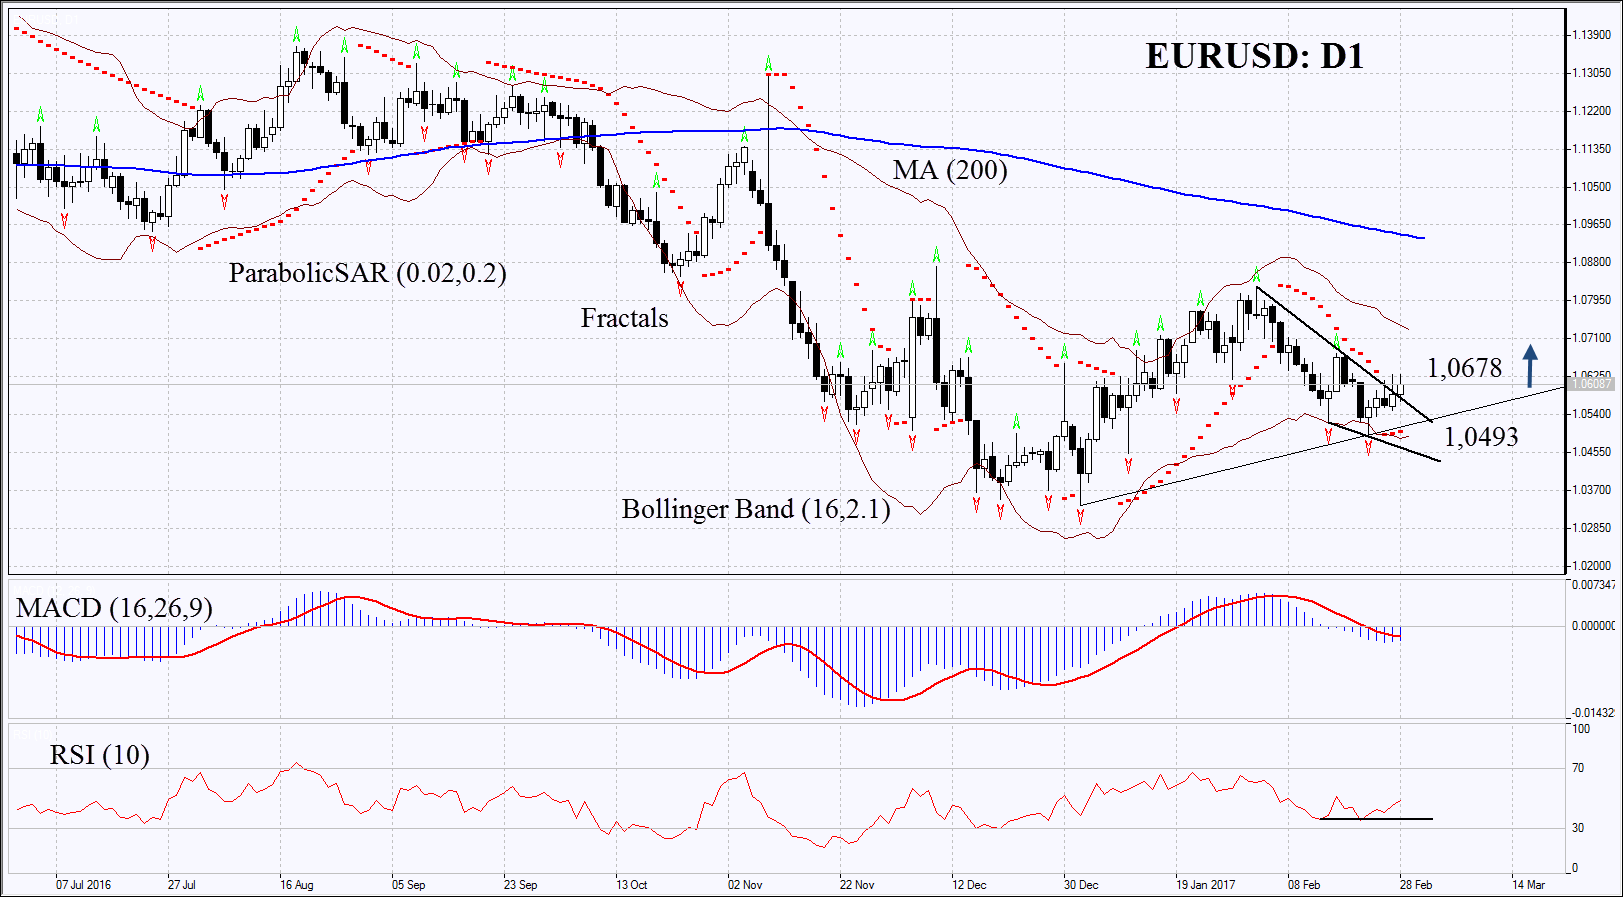
On the daily chart EURUSD: D1 has left upwards from the short-term downtrend. Its further increase is possible in case the positive economic data cone out in Europe and weak in US as well as in case the Fed announces no rake hike on its next meeting on March 15.
- The Parabolic indicator gives bullish signal.
- The Bollinger bands have narrowed which means lower volatility.
- The RSI is below 50. It has formed positive divergence.
- The MACD is giving weak signal to rise.
The bullish momentum may develop in case EURUSD surpasses the last fractal high at 1,0678. This level may serve the point of entry. The initial stop-loss may be placed below the Parabolic signal, the Bollinger band and the last fractal low at 1,0493. Having opened the pending order we shall move the stop to the next fractal low following the Parabolic and Bollinger signals. Thus, we are changing the probable profit/loss ratio to the breakeven point. The most risk-averse traders may switch to the 4-hour chart after the trade and place there a stop-loss moving it in the direction of the trade. If the price meets the stop-loss level at 1,0493 without reaching the order at 1,0678, we recommend cancelling the position: the market sustains internal changes which were not taken into account.
Summary of technical analysis
| Position | Buy |
| Buy stop | above 1.0678 |
| Stop loss | below 1.0493 |
Explore our
Trading Conditions
- Spreads from 0.0 pip
- 30,000+ Trading Instruments
- Stop Out Level - Only 10%
Ready to Trade?
Open Account Note:
This overview has an informative and tutorial character and is published for free. All the data, included in the overview, are received from public sources, recognized as more or less reliable. Moreover, there is no guarantee that the indicated information is full and precise. Overviews are not updated. The whole information in each overview, including opinion, indicators, charts and anything else, is provided only for familiarization purposes and is not financial advice or а recommendation. The whole text and its any part, as well as the charts cannot be considered as an offer to make a deal with any asset. IFC Markets and its employees under any circumstances are not liable for any action taken by someone else during or after reading the overview.
