- Analytics
- Technical Analysis
GB 100 Index Technical Analysis - GB 100 Index Trading: 2019-08-23
Weak UK data bearish for GB100
Retail sales growth slowed in July after GDP contraction in second quarter. Will the GB 100 continue declining?
Recent UK economic data were negative on balance after the second quarter GDP contracted 0.2% over quarter follwoing 0.5% growth in Q1. And retail sales growth slowed in July though a decline was expected, with retail price index growth slowing to 2.8% over year in July from 2.9%. Weaker economic data are bearish for GB100.
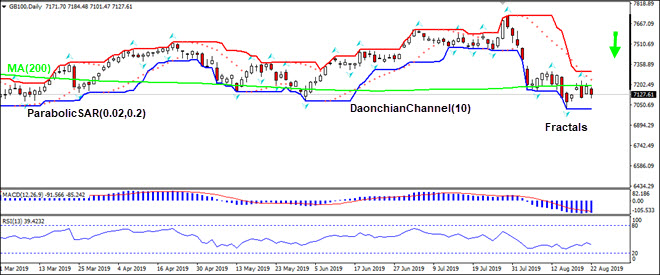
On the daily timeframe the GB100: D1 is below the 200-day moving average MA(200) which has levelled off.
- The Parabolic indicator gives a sell signal.
- The Donchian channel indicates no trend yet: it is flat.
- The MACD indicator gives a neutral signal: it is below the signal line and the gap is steady.
- The RSI oscillator is declining but has not reached the oversold zone yet.
We believe the bearish momentum will continue after the price breaches below the lower boundary of Donchian channel at 7017.13. This level can be used as an entry point for placing a pending order to sell. The stop loss can be placed above the upper Donchian channel at 7303.07. After placing the order, the stop loss is to be moved every day to the next fractal high, following Parabolic signals. Thus, we are changing the probable profit/loss ratio to the breakeven point. If the price meets the stop loss level (7303.07) without reaching the order (7017.73), we recommend cancelling the order: the market has undergone internal changes which were not taken into account.
Technical Analysis Summary
| Order | Sell |
| Sell stop | Below 7017.73 |
| Stop loss | Above 7303.07 |
Explore our
Trading Conditions
- Spreads from 0.0 pip
- 30,000+ Trading Instruments
- Stop Out Level - Only 10%
Ready to Trade?
Open Account Note:
This overview has an informative and tutorial character and is published for free. All the data, included in the overview, are received from public sources, recognized as more or less reliable. Moreover, there is no guarantee that the indicated information is full and precise. Overviews are not updated. The whole information in each overview, including opinion, indicators, charts and anything else, is provided only for familiarization purposes and is not financial advice or а recommendation. The whole text and its any part, as well as the charts cannot be considered as an offer to make a deal with any asset. IFC Markets and its employees under any circumstances are not liable for any action taken by someone else during or after reading the overview.
