- Analytics
- Technical Analysis
GBP USD Technical Analysis - GBP USD Trading: 2017-04-05
Conflict over Gibraltar
On the background of Great Britain’s exit from the EU, the issue of Gibraltar status has escalated. Will the British pound decline?
Last week Great Britain officially started the process of exiting from the EU, when it submitted the corresponding statement to the European Council. Gibraltar is its overseas territory and is situated between Spain and Africa. Theoretically, after Brexit, it may remain in the EU. Previously, the former leader of the Conservatives - the head of the Republican party of Great Britain Michael Howard, expressed an opinion that the current prime minister Theresa May might start a war to stand up for Gibraltar, as Margaret Thatcher did in early 1980s over the Falkland Islands claimed by Argentina. Theresa May herself said that she would never agree with the decision on the disputed territory, which would violate the rights of residents of the territory. Currently, consultations on Gibraltar status are carried out between Great Britain, the EU and Spain. This Friday, the Governor of the Bank of England Mark Carney is expected to speak, which may affect the exchange rate of the pound. On the same day, important British economic statistics will be released: the foreign trade balance for February, as well as industrial production and construction spending.
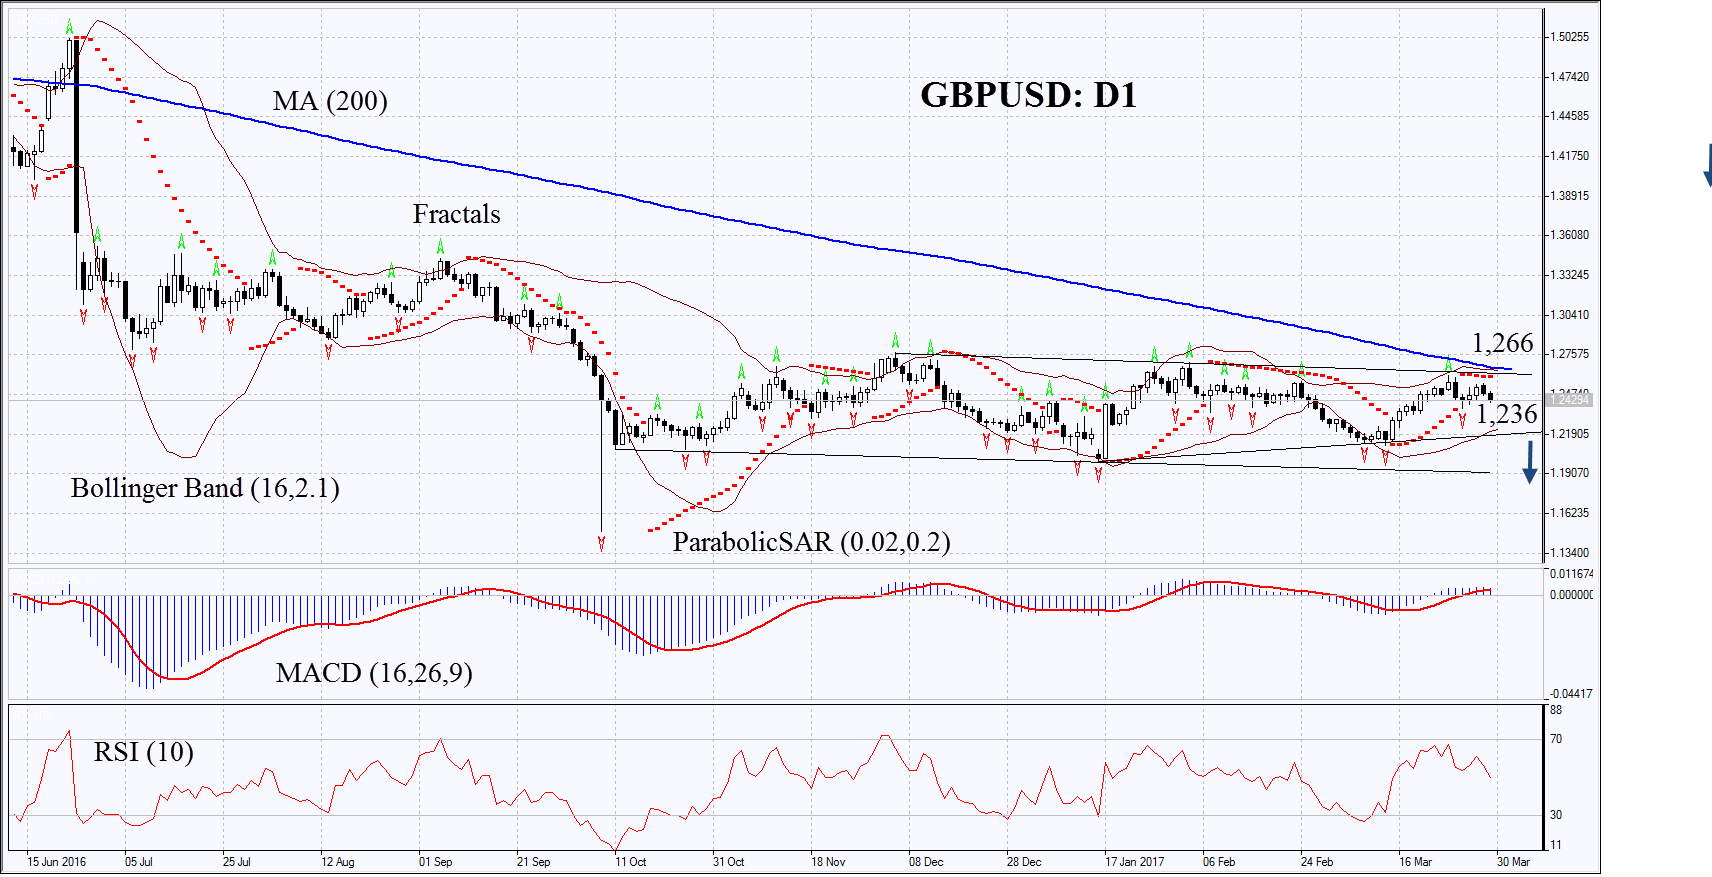
On the daily timeframe, GBPUSD: D1 is in the neutral trend. Last week, it reached its upper boundary, but could not surpass it. Currently, the pound is trying to correct down. Further decrease of prices is possible in case of escalation of the political situation on the background of Brexit or in case of the publication of weak economic statistics in Great Britain.
- The Parabolic indicator gives bearish signals.
- The Bollinger bands have narrowed, which means lower volatility.
- The RSI is near 50. No divergence.
- The MACD gives bearish signals.
The bearish momentum may develop in case GBPUSD drops below the last fractal low at 1.236. This level may serve as the entry point. The initial stop-loss may be placed above the last fractal high, the 200-day moving average, the Parabolic signal and the upper Bollinger band at 1.266. After opening the pending order, we shall move the stop to the next fractal high following the Bollinger and Parabolic signals. Thus, we are changing the potential profit/loss to the breakeven point. More risk-averse traders may switch to the 4-hour chart after the trade and place there a stop-loss moving it in the direction of the trade. If the price meets the stop level at 1.236 without reaching the order at 1.266 we recommend cancelling the position: the market sustains internal changes that were not taken into account.
Technical Analysis Summary
| Position | Sell |
| Sell stop | Below 1,236 |
| Stop loss | Above 1,266 |
Explore our
Trading Conditions
- Spreads from 0.0 pip
- 30,000+ Trading Instruments
- Stop Out Level - Only 10%
Ready to Trade?
Open Account Note:
This overview has an informative and tutorial character and is published for free. All the data, included in the overview, are received from public sources, recognized as more or less reliable. Moreover, there is no guarantee that the indicated information is full and precise. Overviews are not updated. The whole information in each overview, including opinion, indicators, charts and anything else, is provided only for familiarization purposes and is not financial advice or а recommendation. The whole text and its any part, as well as the charts cannot be considered as an offer to make a deal with any asset. IFC Markets and its employees under any circumstances are not liable for any action taken by someone else during or after reading the overview.
