- Analytics
- Technical Analysis
Cattle Futures Technical Analysis - Cattle Futures Trading: 2019-09-26
Better than forecast sales bullish for LCATTLE
US cattle sales were better than expected in August. Will the LCATTLE continue gaining?
USDA Cattle on Feed Report for September was supportive for beef demand. According to the report released last Friday, sales of fed cattle during August were 1.5% below 2018, totaling 1.953 million head, when a decrease of 1.7% was expected taking into account the record 2018 result. And the live-to-cutout beef spread, which gives the revenue from wholesale beef and by-product sales less the cost of a live animal and determines meat packers’ gross margins, has risen in August compared to spreads of the same period a year ago. Better cattle seals are bullish for live cattle price.
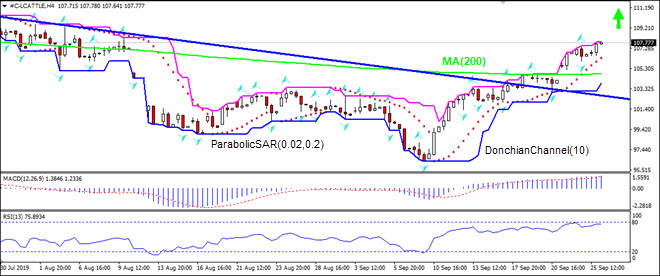
On the 4-hour timeframe the LCATTLE: H4 has risen above the 200-day moving average MA(200) and resistance line.
- The Parabolic indicator gives a buy signal.
- > The Donchian channel indicates uptrend: it is narrowing up.
- The MACD indicator gives a bullish signal: it is above the signal line and the gap is widening.
- The RSI oscillator is near the overbought zone but has not crossed into it.
We believe the bullish momentum will continue after the price breaches above the upper boundary of Donchian channel at 107.84. This level can be used as an entry point for placing a pending order to buy. The stop loss can be placed below the lower Donchian boundary at 103.86. After placing the order, the stop loss is to be moved every day to the next fractal low, following Parabolic signals. Thus, we are changing the expected profit/loss ratio to the breakeven point. If the price meets the stop loss level (103.86) without reaching the order (107.84), we recommend cancelling the order: the market has undergone internal changes which were not taken into account.
Technical Analysis Summary
| Order | Buy |
| Buy stop | Above 107.84 |
| Stop loss | Below 103.86 |
Explore our
Trading Conditions
- Spreads from 0.0 pip
- 30,000+ Trading Instruments
- Stop Out Level - Only 10%
Ready to Trade?
Open Account Note:
This overview has an informative and tutorial character and is published for free. All the data, included in the overview, are received from public sources, recognized as more or less reliable. Moreover, there is no guarantee that the indicated information is full and precise. Overviews are not updated. The whole information in each overview, including opinion, indicators, charts and anything else, is provided only for familiarization purposes and is not financial advice or а recommendation. The whole text and its any part, as well as the charts cannot be considered as an offer to make a deal with any asset. IFC Markets and its employees under any circumstances are not liable for any action taken by someone else during or after reading the overview.
