- Analytics
- Technical Analysis
Gas Ruble Technical Analysis - Gas Ruble Trading: 2017-03-02
Cold spring may raise demand for heating gas
In this report we consider studying the personal composite instrument (PCI) ”gas to ruble”. It may rise in case the prices of US natural gas (Natgas) are to increase together with USDRUB rate.
The price of natural gas slumped by a third in the US since last December. This happed on lower demand for gas for heating as weather was warmer in November-March than in previous winter season. Gas prices started to rise recently as this March weather shall be colder than a year ago. The demand for gas in US will surpass 88bn cubic feet a day this and the following weeks. This is 12.4% higher than the daily consumption of 78.3bn cubic feet last week. The stocks of US natural gas are just 7% above the last-year’s level. Its average level of production in US for the recent 30 days is 70.3bn cubic feet a day. This is 5.4% below the level of the same period of 2016. Ruble may lose ground to the US dollar on currency interventions by Russia Ministry of Finance. Moreover, there are some chances that Central Bank of Russia might cut the rates on its next meeting on March 24, 2017.
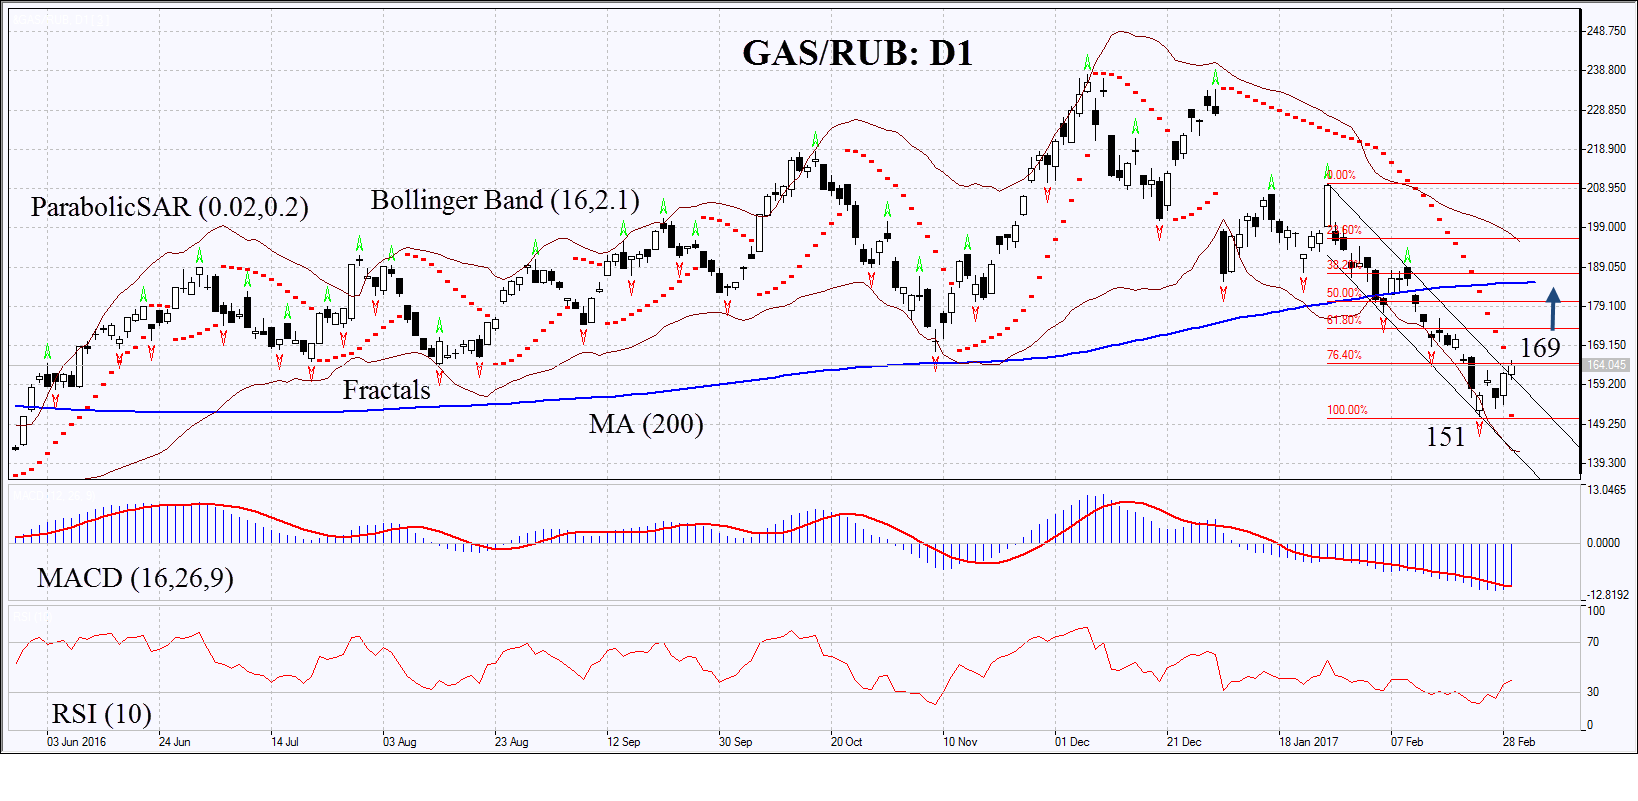
On the daily chart GAS/RUB: D1 has hit a fresh 8-month low but then left the descending channel to move upwards. The uptrend may continue in case gas prices and USDRUB rate advance.
- The Parabolic indicator gives bullish signal.
- The Bollinger bands have widened a lot which means higher volatility.
- The RSI is below 50. No divergence.
- The MACD gives signals to rise.
The bullish momentum may develop in case GAS/RUB closes the upper prices gap and surpasses the Parabolic signal at 169. This level may serve the point of entry. The initial stop-loss may be placed below the Parabolic signal and the last fractal low and the 8-year low at 151. Having opened the pending order we shall move the stop to the next fractal low following the Parabolic and Bollinger signals. Thus, we are changing the probable profit/loss ratio to the breakeven point. The most risk-averse traders may switch to the 4-hour chart after the trade and place there a stop-loss moving it in the direction of the trade. If the price meets the stop-loss level at 151 without reaching the order at 169, we recommend cancelling the position: the market sustains internal changes which were not taken into account.
Summary of technical analysis
| Position | Buy |
| Buy stop | above 169 |
| Stop loss | below 151 |
Explore our
Trading Conditions
- Spreads from 0.0 pip
- 30,000+ Trading Instruments
- Stop Out Level - Only 10%
Ready to Trade?
Open Account Note:
This overview has an informative and tutorial character and is published for free. All the data, included in the overview, are received from public sources, recognized as more or less reliable. Moreover, there is no guarantee that the indicated information is full and precise. Overviews are not updated. The whole information in each overview, including opinion, indicators, charts and anything else, is provided only for familiarization purposes and is not financial advice or а recommendation. The whole text and its any part, as well as the charts cannot be considered as an offer to make a deal with any asset. IFC Markets and its employees under any circumstances are not liable for any action taken by someone else during or after reading the overview.
