- Analytics
- Technical Analysis
Nasdaq 100 Technical Analysis - Nasdaq 100 Trading: 2018-08-09
Strong US data bullish for Nd100
Average hourly earnings grew more in July as factory orders rose in June. Will the Nd100 continue rising?
Recent US economic data after the Federal Reserve’s last meeting were positive on balance. While nonfarm payrolls’ 157,000 increase in July missed expectations and was below previous month’s increase, the average hourly earnings over month rose more than in June: 0.3% vs. 0.1%. This means the uptrend in personal income continues after strong second quarter GDP report which showed the economic growth accelerated to 4.1% from 2.2% in Q1. And while manufacturing PMI declined to still strong 58.1 in July from 60.2, factory orders rose more than in previous month: 0.7% in June after 0.4% gain in May. On Tuesday the Labor Department reported there were 6.66 million job openings at the end of June, up fractionally from May’s levels and the third highest in history. This also attests to labor market’s strength. Strong economic data are bullish for Nd100.
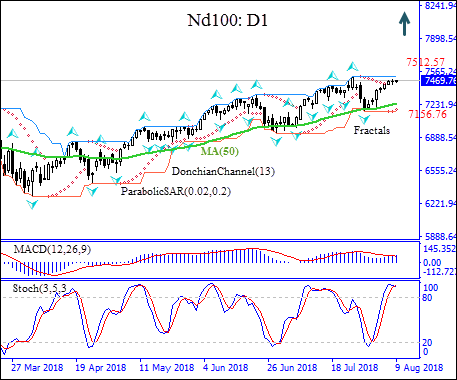
On the daily timeframe the Nd100: D1 is above the 50-day moving average MA(50) which is rising, this is bullish.
- The Parabolic indicator gives a buy signal.
- The Donchian channel indicates no trend yet: it is flat.
- The MACD indicator gives a bullish signal: it is above the signal line and the gap is widening.
- The Stochastic oscillator is in the overbought zone, this is bearish.
We believe the bullish momentum will continue after the price breaches above the upper boundary of Donchian channel at 7512.27. This level can be used as an entry point for placing a pending order to buy. The stop loss can be placed below the lower Donchian channel at 7156.76. After placing the order, the stop loss is to be moved every day to the next fractal low, following Parabolic signals. Thus, we are changing the probable profit/loss ratio to the breakeven point. If the price meets the stop loss level (7156.76) without reaching the order (7512.27), we recommend cancelling the order: the market has undergone internal changes which were not taken into account.
Technical Analysis Summary
| Position | Buy |
| Buy stop | Above 7512.27 |
| Stop loss | Below 7156.76 |
Explore our
Trading Conditions
- Spreads from 0.0 pip
- 30,000+ Trading Instruments
- Stop Out Level - Only 10%
Ready to Trade?
Open Account Note:
This overview has an informative and tutorial character and is published for free. All the data, included in the overview, are received from public sources, recognized as more or less reliable. Moreover, there is no guarantee that the indicated information is full and precise. Overviews are not updated. The whole information in each overview, including opinion, indicators, charts and anything else, is provided only for familiarization purposes and is not financial advice or а recommendation. The whole text and its any part, as well as the charts cannot be considered as an offer to make a deal with any asset. IFC Markets and its employees under any circumstances are not liable for any action taken by someone else during or after reading the overview.
