- Analytics
- Technical Analysis
SUGAR Technical Analysis - SUGAR Trading: 2017-10-04
An increase in demand for sugar is expected in Indonesia
Indonesia Food and Beverage Association forecasts an increase in sugar consumption in the country in 2018 to 3.35 mln tonnes compared to 3.2 mln tonnes this year. Will the sugar prices grow?
An additional factor may be the increase in bioethanol sales in Brazil after the approval of the benefits for its producers. In August 2017, it increased by 10.7% compared to July and reached 1.076 bln liters. At the same time, gasoline consumption decreased by 1.4%.
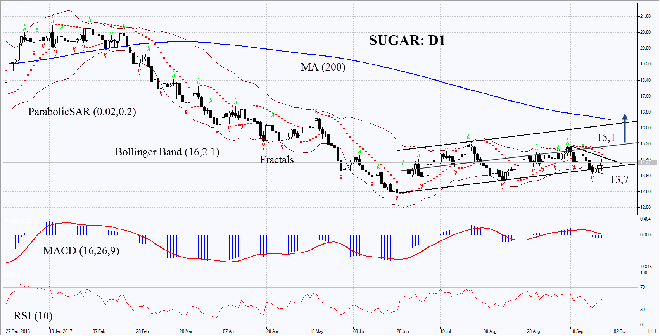
On the daily timeframe, SUGAR: D1 reached the lower boundary of the rising channel. It could not overcome it and may move towards the upper boundary. Further price increase is possible in case of maintaining the increased world demand and the crop decrease in certain countries.
- The Parabolic indicator gives a bearish signal. It can be used as an additional resistance level, which needs to be exceeded before opening a Buy position.
- The Bollinger bands are narrowing, which means lower volatility.
- The RSI indicator is below 50. No divergence.
- The MACD indicator gives a bearish signal.
The bullish momentum may develop in case SUGAR exceeds the two last fractal highs, the upper Bollinger band and the Parabolic signal at 15.1. This level may serve as an entry point. The initial stop loss may be placed below the last fractal low and the lower Bollinger band at 13.7. After opening the pending order, we shall move the stop to the next fractal low following the Bollinger and Parabolic signals. Thus, we are changing the potential profit/loss to the breakeven point. More risk-averse traders may switch to the 4-hour chart after the trade and place there a stop loss moving it in the direction of the trade. If the price meets the stop level at 13.7 without reaching the order at 15.1 we recommend cancelling the position: the market sustains internal changes that were not taken into account.
Summary of technical analysis
| Position | Buy |
| Buy stop | above 15,1 |
| Stop loss | below 13,7 |
Explore our
Trading Conditions
- Spreads from 0.0 pip
- 30,000+ Trading Instruments
- Stop Out Level - Only 10%
Ready to Trade?
Open Account Note:
This overview has an informative and tutorial character and is published for free. All the data, included in the overview, are received from public sources, recognized as more or less reliable. Moreover, there is no guarantee that the indicated information is full and precise. Overviews are not updated. The whole information in each overview, including opinion, indicators, charts and anything else, is provided only for familiarization purposes and is not financial advice or а recommendation. The whole text and its any part, as well as the charts cannot be considered as an offer to make a deal with any asset. IFC Markets and its employees under any circumstances are not liable for any action taken by someone else during or after reading the overview.
