- Analytics
- Technical Analysis
USD CAD Technical Analysis - USD CAD Trading: 2014-12-15
Oil driver for bulls
Here we consider USD/CAD currency pair on the H4 chart. As oil prices keep falling, the Canadian dollar continues to slump. The price is moving within the limits of D1 and H4 uptrend channel: bullish trend is observed for all the timeframe scales. The trend is confirmed by ParabolicSAR values, which cross the line and fractal support level. Donchian Channel is also indicating the bullish bias. There is no contradiction on the part of the RSI-Bars oscillator. At the moment, it approached the local resistance level at 76.2609%. We expect that this level would be crossed when the price breaks the resistance level at 1.15294. This mark can be used for opening a pending buy order. Stop Loss is better to be placed at the Bill Williams support fractal 1.15106, which is strengthened by Parabolic historical values.
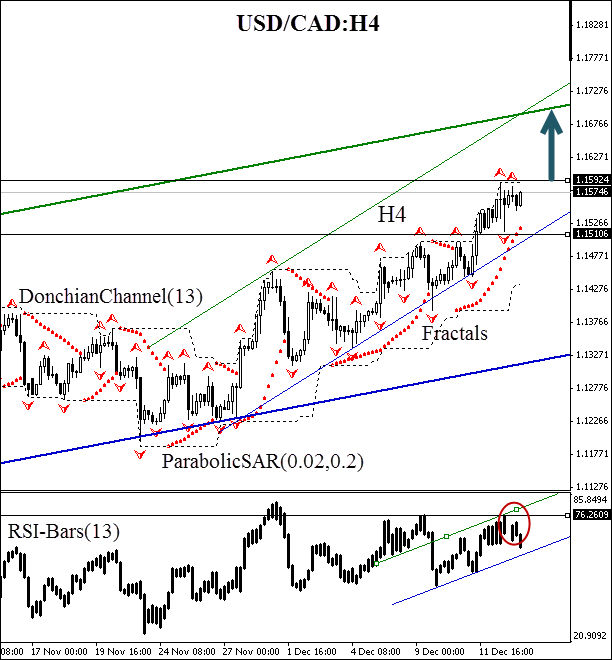
After position opening, Stop Loss is to be moved after the Parabolic values, near the next fractal low. Updating is enough to be done every day after a new Bill Williams fractal formation (5 candlesticks). Thus, we are changing the probable profit/loss ratio to the breakeven point.
| Position | Buy |
| Buy stop | above 1.15294 |
| Stop loss | below 1.15106 |
Dear traders. For the detailed report of the strategy based on analytical issues of technical analysis click here.
Explore our
Trading Conditions
- Spreads from 0.0 pip
- 30,000+ Trading Instruments
- Stop Out Level - Only 10%
Ready to Trade?
Open Account Note:
This overview has an informative and tutorial character and is published for free. All the data, included in the overview, are received from public sources, recognized as more or less reliable. Moreover, there is no guarantee that the indicated information is full and precise. Overviews are not updated. The whole information in each overview, including opinion, indicators, charts and anything else, is provided only for familiarization purposes and is not financial advice or а recommendation. The whole text and its any part, as well as the charts cannot be considered as an offer to make a deal with any asset. IFC Markets and its employees under any circumstances are not liable for any action taken by someone else during or after reading the overview.
