- Analytics
- Technical Analysis
USD JPY Technical Analysis - USD JPY Trading: 2014-10-22
Japanese yen choosing way
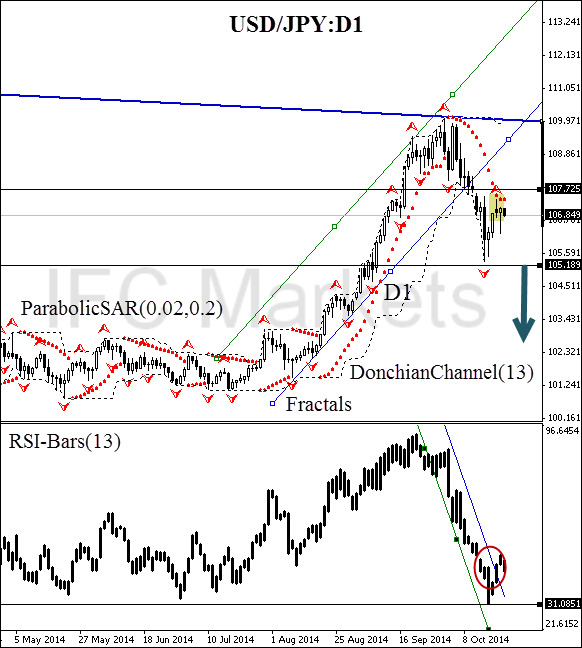
Today we consider the USD/JPY currency pair on the D1 chart. The price made a reversal, touching the strong W1 resistance line. The daily uptrend channel is breached in the direction of the red zone, and now we have every reason to believe that a new bearish D1 trend is emerging. Parabolic confirms the trend direction and moves along the DonchianChannel lower boundary, verifying the price direction. The only alarming signal can be seen at the moment is the breach of RSI-Bars resistance line, which may be proved false. To confirm the bearish sentiment, you should wait for the oscillator level crossing at 31.0851%.
This event is expected to happen before the fractal support breach at 105.189. This mark is strengthened by DonchianChannel lower boundary and can be used for placing a pending sell order. Stop Loss can be placed at 107.725 or 109.971 (for conservative traders). It should be noted that the importance of the last fractal peak is confirmed by the Parabolic historical value, and also the bearish candlestick pattern “shooting star”, which is marked in yellow on the chart.
After position opening, Trailing Stop is to be moved after the Parabolic values, near the next fractal peak. Updating is enough to be done every day after the formation of 5 new candlesticks, needed for the Bill Williams fractal formation. Thus, we are changing the probable profit/loss ratio to the breakeven point.
| Position | Sell |
| Sell stop | below 105.189 |
| Stop loss | above 107.725 |
Dear traders. You can see the detailed report of the author’s account by clicking here.
Explore our
Trading Conditions
- Spreads from 0.0 pip
- 30,000+ Trading Instruments
- Stop Out Level - Only 10%
Ready to Trade?
Open Account Note:
This overview has an informative and tutorial character and is published for free. All the data, included in the overview, are received from public sources, recognized as more or less reliable. Moreover, there is no guarantee that the indicated information is full and precise. Overviews are not updated. The whole information in each overview, including opinion, indicators, charts and anything else, is provided only for familiarization purposes and is not financial advice or а recommendation. The whole text and its any part, as well as the charts cannot be considered as an offer to make a deal with any asset. IFC Markets and its employees under any circumstances are not liable for any action taken by someone else during or after reading the overview.
