- Analytics
- Technical Analysis
USD JPY Technical Analysis - USD JPY Trading: 2017-01-30
Awaiting BOJ meeting
Bank of Japan unexpectedly raised its bond-buying program for 5-10-year bonds up to 450bn yen ($3,92bn). Previously, the bank 6 times purchased these bonds to amount of 410bn yen via monetary emission. Will yen continue weakening?
Total volume of buying state bonds, both short- and long-term, in Japan is assumed to be 8.trn yen in 2017. Bank of Japan confirmed that annual bond-buying volume will not exceed previously confirmed 80trn yen. But some markets participants worry that the volume may be raised in 2nd part of the year. The December 2016 inflation data came out in Japan on Friday. It fell to 0.3% year on year after 0.5% in November which is far below the target level of the Bank of Japan. The bank has long been struggling for raising inflation to 2% a year. In theory, the consumer price index lets make monetary policy a bit looser. Trade balance surplus surged in December 2016 which also supports monetary stimulus. The next BOJ meeting will take place on January 31, 2017. No rate change is expected but comments from the Bank and its economic report may affect yen.
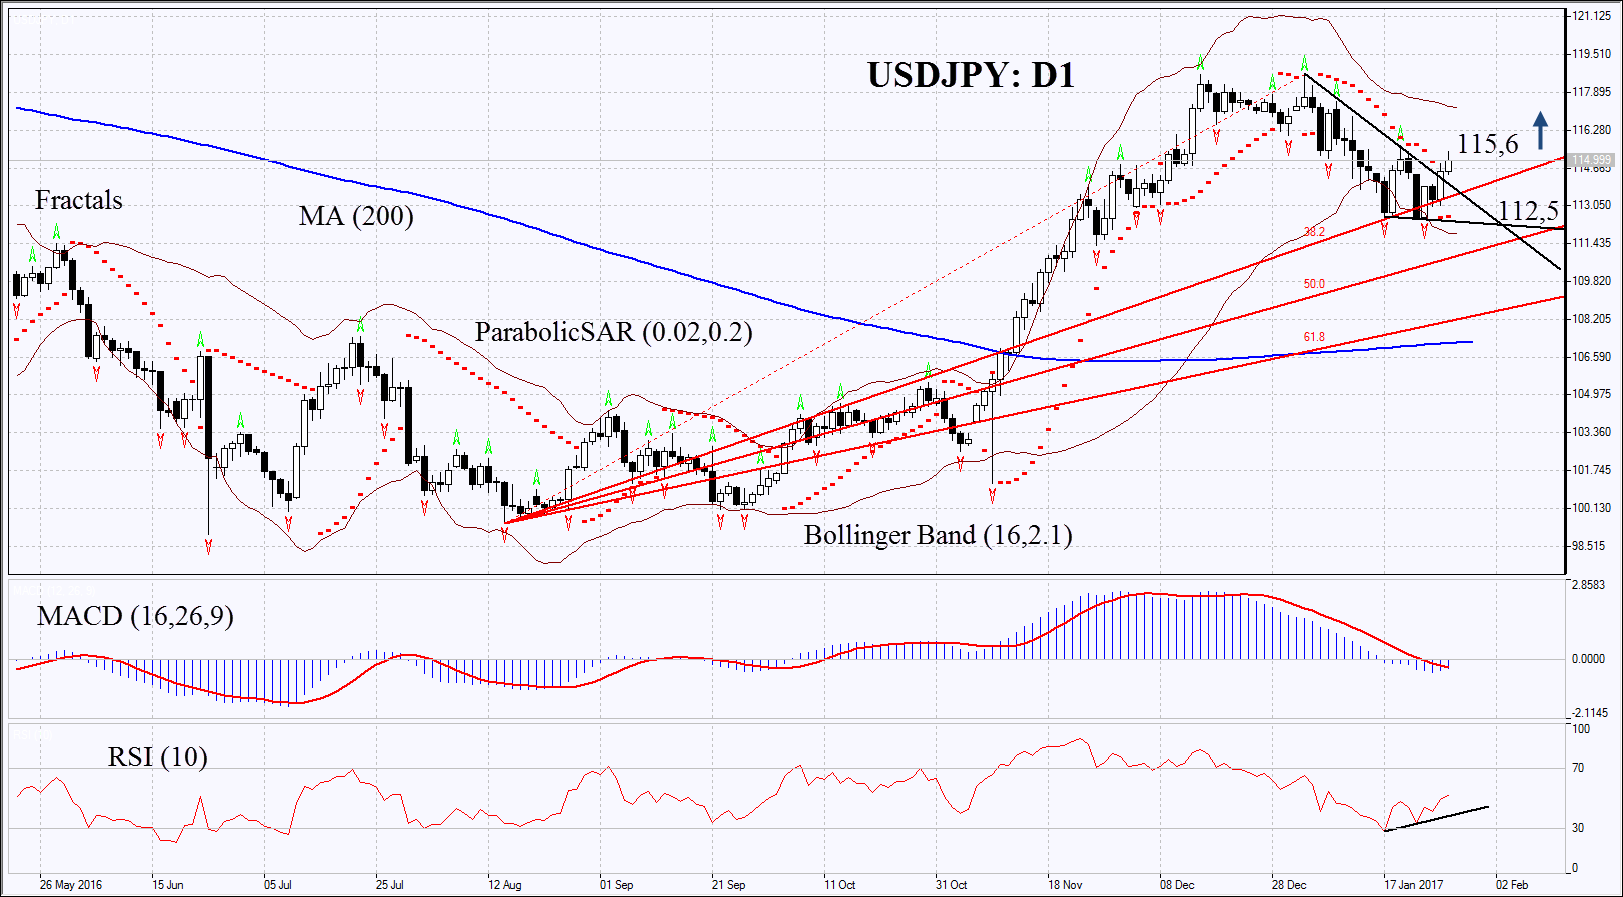
On the daily chart USDJPY: D1 has left the downtrend having bounced up from the Fibonacci Fan line. Further price increase, which means weaker yen, is possible in case of weaker monetary policy by the BOJ or negative economic data.
- The Parabolic is giving bullish signal.
- The Bollinger bands have narrowed which means low volatility.
- The RSI is above 50 having formed positive divergence.
- The MACD gives bullish signal.
The bullish momentum may develop in case USDJPY surpasses the last fractal high at 115.6. This level may serve the point of entry. The initial stop-loss may be placed below the Parabolic signal and the last fractal low at 112.5. Having opened the pending order we shall move the stop to the next fractal low following the Parabolic and Bollinger signals. Thus, we are changing the probable profit/loss ratio to the breakeven point. The most risk-averse traders may switch to the 4-hour chart after the trade and place there a stop-loss moving it in the direction of the trade. If the price meets the stop-loss level at 112.5 without reaching the order at 115.6, we recommend cancelling the position: the market sustains internal changes which were not taken into account.
Summary of technical analysis
| Position | Buy |
| Buy stop | above 115.6 |
| Stop loss | below 112.5 |
Explore our
Trading Conditions
- Spreads from 0.0 pip
- 30,000+ Trading Instruments
- Stop Out Level - Only 10%
Ready to Trade?
Open Account Note:
This overview has an informative and tutorial character and is published for free. All the data, included in the overview, are received from public sources, recognized as more or less reliable. Moreover, there is no guarantee that the indicated information is full and precise. Overviews are not updated. The whole information in each overview, including opinion, indicators, charts and anything else, is provided only for familiarization purposes and is not financial advice or а recommendation. The whole text and its any part, as well as the charts cannot be considered as an offer to make a deal with any asset. IFC Markets and its employees under any circumstances are not liable for any action taken by someone else during or after reading the overview.
