- Analytics
- Technical Analysis
USD JPY Technical Analysis - USD JPY Trading: 2017-04-25
Preparing for the Bank of Japan meeting
Early on Thursday morning, April 2017, the next meeting of the Bank of Japan will take place. Investors do not exclude any statements about the loosening of monetary policy. Will the Japanese yen weaken? On the USDJPY chart, it shows as increase.
On Tuesday, the head of the Bank of Japan Haruhiko Kuroda said that that G20 and IMF agreed that the Bank of Japan continues to implement quantitative еаsing to achieve the target inflation rate and support economic growth. Let us recall that the inflation rate in Japan is 0, 3%, and its target level - 2%. With the aim to increase inflation rate, the Bank of Japan has been implementing monetary emission (quantitative easing) in the amount of 80 trillion yen per year since 2013. Meanwhile, it maintains the rate at the level of minus 0, 1%. At the meeting of the Bank of Japan, no rate changes are expected, but some other additional measures for monetary stimulation of the Japanese economy may be announced. The next meeting of the Japanese regulator will take place only on June 16, 2017. Note that early on Friday, April 2017, significant economic statistics will come out in Japan: unemployment, household spending, inflation, retail sales and industrial production. These data may also affect the yen.
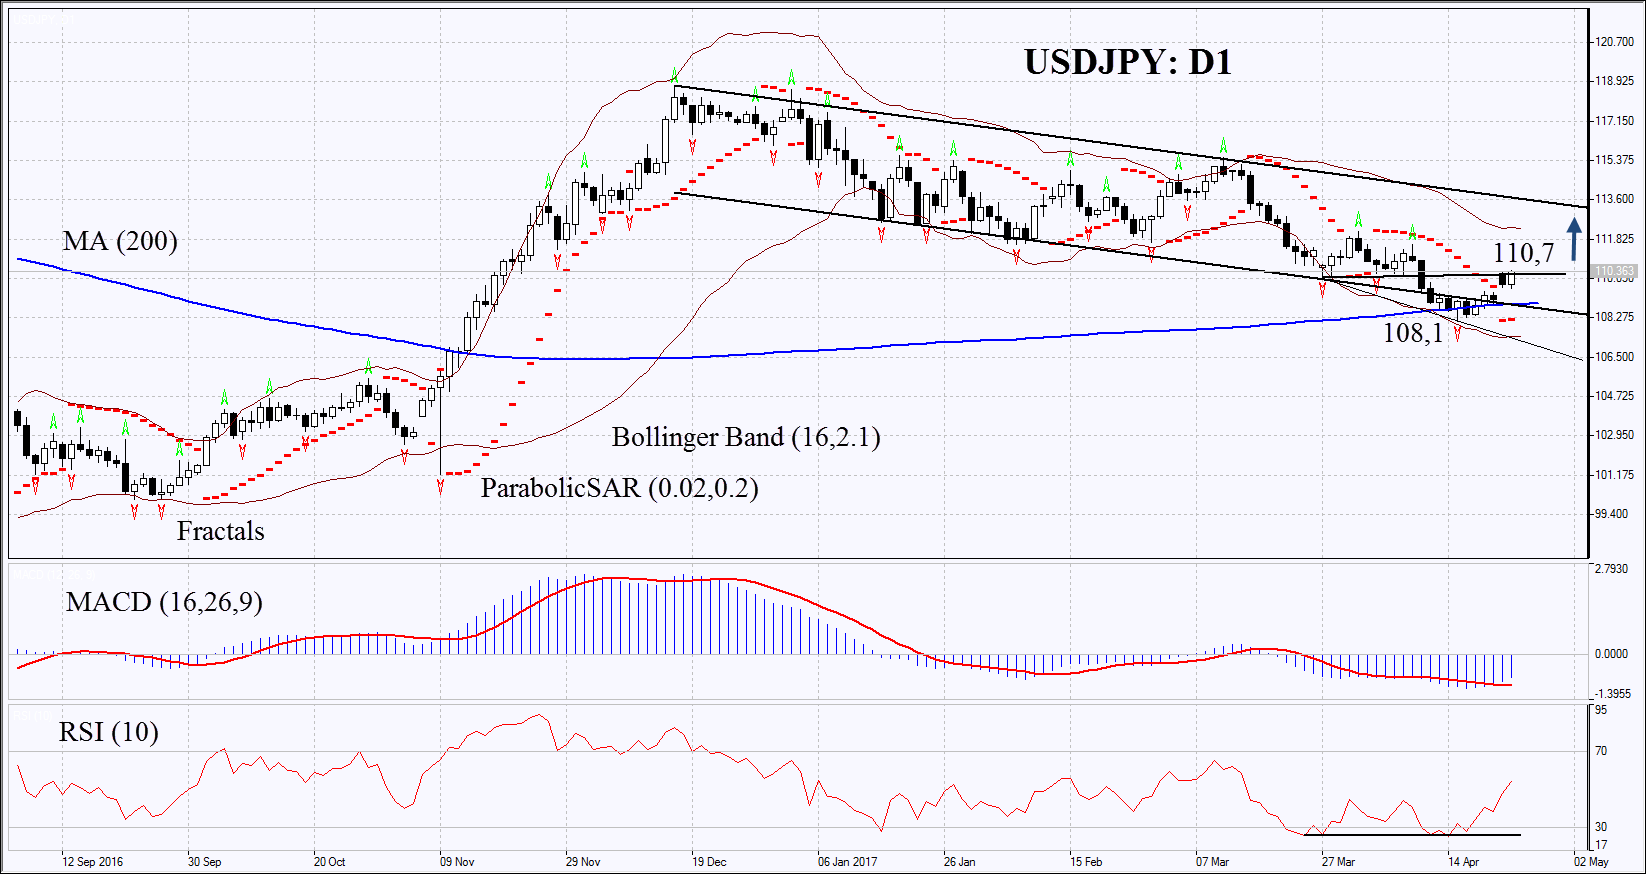
On the daily timeframe, USDJPY: D1 is in a downtrend. The reversal of prices upward is possible in case of further easing of the monetary policy of the Bank of Japan and weak economic indicators.
- The Parabolic indicator gives bullish signals.
- The Bollinger bands have widened, which means higher volatility.
- The RSI indicator is above 50. It has formed a positive divergence.
- The MACD indicator is giving bullish signals.
The bullish momentum may develop in case USDJPY exceeds the horizontal intermediate support – resistance line at 110, 7. This level may serve as the entry point. The initial stop-loss may be placed below the 200-day moving average line, the Parabolic signal, and the last fractal low at 108, 1. After opening the pending order, we shall move the stop to the next fractal low following the Parabolic and Bollinger signals. Thus, we are changing the potential profit/loss to the breakeven point. More risk-averse traders may switch to the 4-hour chart after the trade and place there a stop-loss moving it in the direction of the trade. If the price meets the stop level at 108, 1 without reaching the order at 110, 7 we recommend cancelling the position: the market sustains internal changes that were not taken into account.
Summary of technical analysis
| Position | Buy |
| Buy stop | 110,7 |
| Stop loss | 108,1 |
Explore our
Trading Conditions
- Spreads from 0.0 pip
- 30,000+ Trading Instruments
- Stop Out Level - Only 10%
Ready to Trade?
Open Account Note:
This overview has an informative and tutorial character and is published for free. All the data, included in the overview, are received from public sources, recognized as more or less reliable. Moreover, there is no guarantee that the indicated information is full and precise. Overviews are not updated. The whole information in each overview, including opinion, indicators, charts and anything else, is provided only for familiarization purposes and is not financial advice or а recommendation. The whole text and its any part, as well as the charts cannot be considered as an offer to make a deal with any asset. IFC Markets and its employees under any circumstances are not liable for any action taken by someone else during or after reading the overview.
