- Analytics
- Technical Analysis
Wheat vs Canadian dollar Technical Analysis - Wheat vs Canadian dollar Trading: 2017-08-09
Preparing for the publication of the monthly USDA report
In this review, we suggest considering the personal composite instrument (PCI) "Wheat vs. Canadian Dollar". It increases in case of the wheat price growth in the world market and the weakening of the Canadian dollar. Is there a possibility for the WHEAT/CAD quotes to increase?
Wheat prices react strongly to weather forecasts in the United States. In the past few days there has been a drought, which contributed to the price growth. Besides, France has reduced wheat exports outside the EU by 61% to 4.97 mln tonnes in the 2016/17 agricultural season, ending on June 30. This occurred because of the poor harvest. Meanwhile, Indonesia and the Philippines are going to buy in 200,000 tonnes of wheat in the world market in September, while India-300,000 tonnes. On Thursday, the US Department of Agriculture is going to publish a monthly survey of supply and demand for world grain crops, which can affect the wheat price dynamics. The Canadian dollar continued weakening on Tuesday on the background of weak foreign trade statistics of China and Germany. Earlier, on Friday, negative data on the Canadian foreign trade were published for June, which also had a negative impact on its exchange rate.
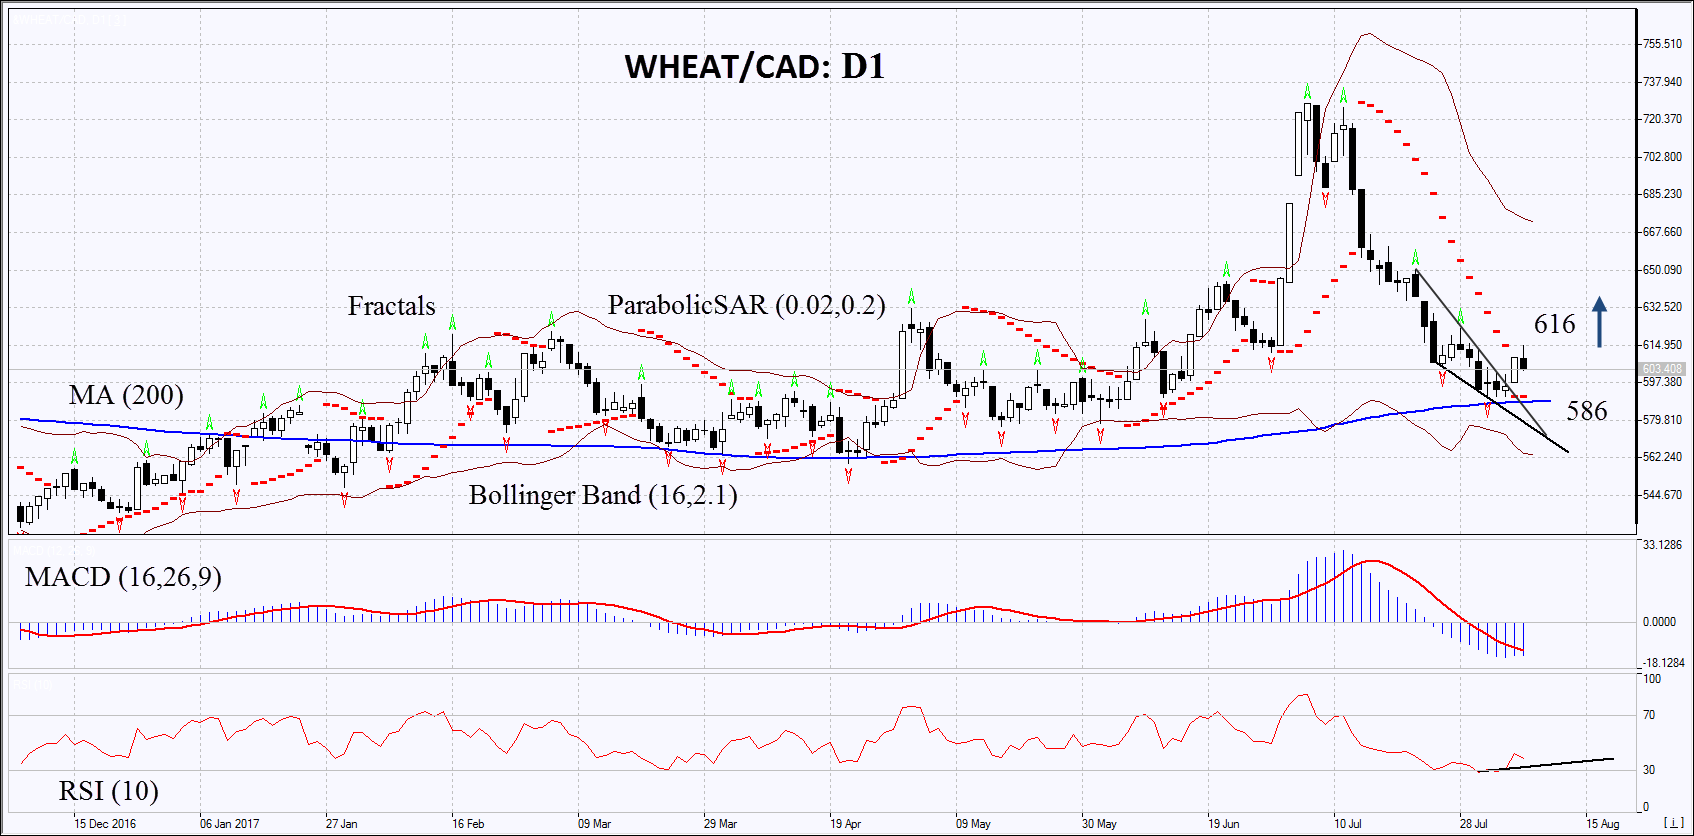
On the daily timeframe, WHEAT/CAD: D1 came out from the downtrend. The further price growth is possible in case of the worsening of the Canadian economic state and a decrease in the world wheat crop.
- The Parabolic indicator gives a bullish signal.
- The Bollinger bands have markedly widened, which means higher volatility.
- The RSI indicator reached the oversold zone and started to rise. It has formed a positive divergence.
- The MACD indicator gives a bullish signal.
The bullish momentum may develop in case WHEAT/CAD exceeds the Tuesday high at 616. This level may serve as an entry point. The initial stop loss may be placed below the last fractal low, the 200-day moving average line and the Parabolic signal at 586. After opening the pending order, we shall move the stop to the next fractal low following the Bollinger and Parabolic signals. Thus, we are changing the potential profit/loss to the breakeven point. More risk-averse traders may switch to the 4-hour chart after the trade and place there a stop loss moving it in the direction of the trade. If the price meets the stop level at 586 without reaching the order at 616 we recommend cancelling the position: the market sustains internal changes that were not taken into account.
Summary of technical analysis
| Position | Buy |
| Buy stop | above 616 |
| Stop loss | below 586 |
Explore our
Trading Conditions
- Spreads from 0.0 pip
- 30,000+ Trading Instruments
- Stop Out Level - Only 10%
Ready to Trade?
Open Account Note:
This overview has an informative and tutorial character and is published for free. All the data, included in the overview, are received from public sources, recognized as more or less reliable. Moreover, there is no guarantee that the indicated information is full and precise. Overviews are not updated. The whole information in each overview, including opinion, indicators, charts and anything else, is provided only for familiarization purposes and is not financial advice or а recommendation. The whole text and its any part, as well as the charts cannot be considered as an offer to make a deal with any asset. IFC Markets and its employees under any circumstances are not liable for any action taken by someone else during or after reading the overview.
