- Analýza
- Technická analýza
Index Hongkongské akciové burzy Technická analýza - Index Hongkongské akciové burzy Obchodování: 2019-09-20
Contraction in private sector bearish for HK50
Hong Kong’s private sector contraction continued in August. Will the HK50 decline?
Recent Hong Kong economic data were weak: retail sales decline accelerated: 13% over year in July versus 7.6% in June. And the August reading of purchasing managers index was below 50 again, indicating contraction in the private sector. Activities in private sector contracted for the seventeenth straight month as new orders dropped due to a record fall in new business from mainland China, pointing to weakness ahead too. The slump in activities is being attributed to US-China trade tensions, as well as protest related disruptions. Continuing decline in activities in private business sector is bearish for HK50.
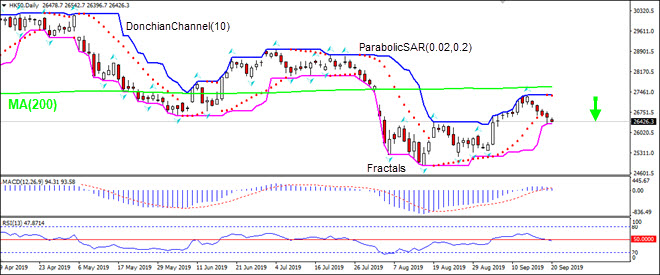
On the daily timeframe HK50: D1 is retracing lower after a rebound following the decline to 8-month low in the beginning of August.
- The Parabolic indicator gives a sell signal.
- The Donchian channel indicates no trend yet: it is flat.
- The MACD indicator is above the signal line with the gap narrowing. This is a bearish signal.
- The RSI oscillator is falling below 50 level.
We believe the bearish momentum will continue after the price breaches below the lower Donchian boundary at 26322.10. This level can be used as an entry point for placing a pending order to sell. The stop loss can be placed above the upper Donchian boundary at 27340.40. After placing the pending order the stop loss is to be moved every day to the next fractal high, following Parabolic signals. Thus, we are changing the expected profit/loss ratio to the breakeven point. If the price meets the stop-loss level (27340.40) without reaching the order (26322.10) we recommend cancelling the order: the market sustains internal changes which were not taken into account.
Technical Analysis Summary
| Position | Sell |
| Sell Stop | Below 26322.10 |
| Stop loss | Above 27340.40 |
- Získejte Certifikát

Poznámka:
Tento přehled má informativně poznávací charakter a publikuje se zdarma. Všechny údaje, uvedené v přehledu, jsou získány z otevřených zdrojů, jsou uznávány více méně spolehlivé. Přitom, neexistují žádné garance, že uvedená informace je úplná a přesná. Přehledy se v budoucnu neobnovují. Veškerá informace v každém přehledu, včetně názorů, ukazatelů, grafů, je pouze poskytována a není finančním poradenstvím nebo doporučením. Celý text nebo jeho jakákoliv část a také grafy nelze považovat za nabídku provádět nějaké transakce s jakýmikoliv aktivy. Společnost IFC Markets a její zaměstnanci za žádných okolností nemají žádnou odpovědnost za jakékoli kroky učiněné kýmkoliv po nebo v průběhu seznámení s přehledem.
