- Analytics
- Technical Analysis
Brent Crude Oil Technical Analysis - Brent Crude Oil Trading: 2019-12-19
Tighter US crude inventories bullish for BRENT
US crude oil inventories declined last week. Will the BRENT rise?
The crude oil output is set to be cut by 500,000 barrels per day starting in January by the Organization of the Petroleum Exporting Countries and other major producers, including Russia, as agreed by OPEC+ earlier this month. And the rising premium held by the nearby Brent contract over later-dated contracts confirm decline in global inventories according to Warren Patterson, head of commodities strategy at ING. Expectations of tighter supplies are bullish for Brent. On the short term supply side, the Energy Information Administration reported US crude inventory fell by 1.1 million barrels last week. Though the decline was smaller than SP Global Platts analysts forecast, data showed increased supply for gasoline up by 0.5% over year for the past four weeks. It is an indication of recovering gasoline demand.
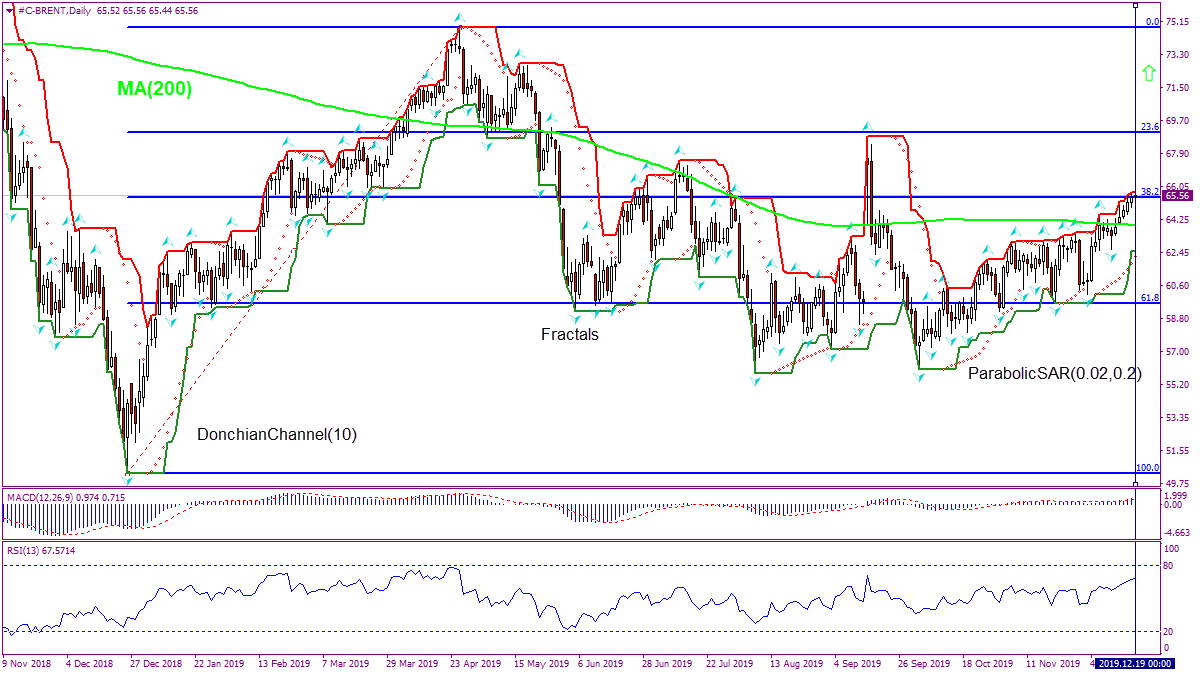
On the daily timeframe the BRENT: D1 is rising above 200-day moving average MA(200), which is still inclined lower. The price is tesing Fibonacci 38.2 level, and further movement higher will confirm upward momentum.
- The Parabolic indicator gives a buy signal.
- The Donchian channel indicates uptrend, it is widening up.
- The MACD indicator gives a bullish signal: it is above the signal line and the gap is widening.
- The RSI oscillator is flat above the 50 level.
We believe the bullish momentum will continue after the price breaches above the upper boundary of Donchian channel at 65.74. A level above this can be used as an entry point for placing a pending order to buy. The stop loss can be placed below the lower Donchian boundary at 62.52. After placing the order, the stop loss is to be moved every day to the next fractal low, following Parabolic signals. Thus, we are changing the expected profit/loss ratio to the breakeven point. If the price meets the stop loss level (62.52) without reaching the order (above 65.74), we recommend cancelling the order: the market has undergone internal changes which were not taken into account.
Technical Analysis Summary
| Order | Buy |
| Buy stop | Above 65.74 |
| Stop loss | Below 62.52 |
Explore our
Trading Conditions
- Spreads from 0.0 pip
- 30,000+ Trading Instruments
- Stop Out Level - Only 10%
Ready to Trade?
Open Account Note:
This overview has an informative and tutorial character and is published for free. All the data, included in the overview, are received from public sources, recognized as more or less reliable. Moreover, there is no guarantee that the indicated information is full and precise. Overviews are not updated. The whole information in each overview, including opinion, indicators, charts and anything else, is provided only for familiarization purposes and is not financial advice or а recommendation. The whole text and its any part, as well as the charts cannot be considered as an offer to make a deal with any asset. IFC Markets and its employees under any circumstances are not liable for any action taken by someone else during or after reading the overview.
