- Analytics
- Technical Analysis
CAD Currency Index Technical Analysis - CAD Currency Index Trading: 2019-12-18
Preparing for the publication of significant statistics in Canada
In this review, we suggest considering the personal composite instrument (PCI) & CAD_Index. It reflects the price dynamics of the Canadian dollar against other world currencies. Will the CAD_Index rise?
The share of hydrocarbons in Canadian exports reaches 25%, therefore, the Canadian dollar may strengthen along with an increase in global oil prices. Inflation data for November will be released on December 18. It is expected to rise to 2.2% year over year from 1.9% in October. This reduces the likelihood of a rate cut by the Bank of Canada at the next meeting on January 22, 2020, and can positively affect the Canadian dollar. The interest rate of the Bank of Canada is 1.75%, and the target range of inflation is 2% plus/minus 1%. Let us note that wholesale and retail sales for October will be published this week in Canada.
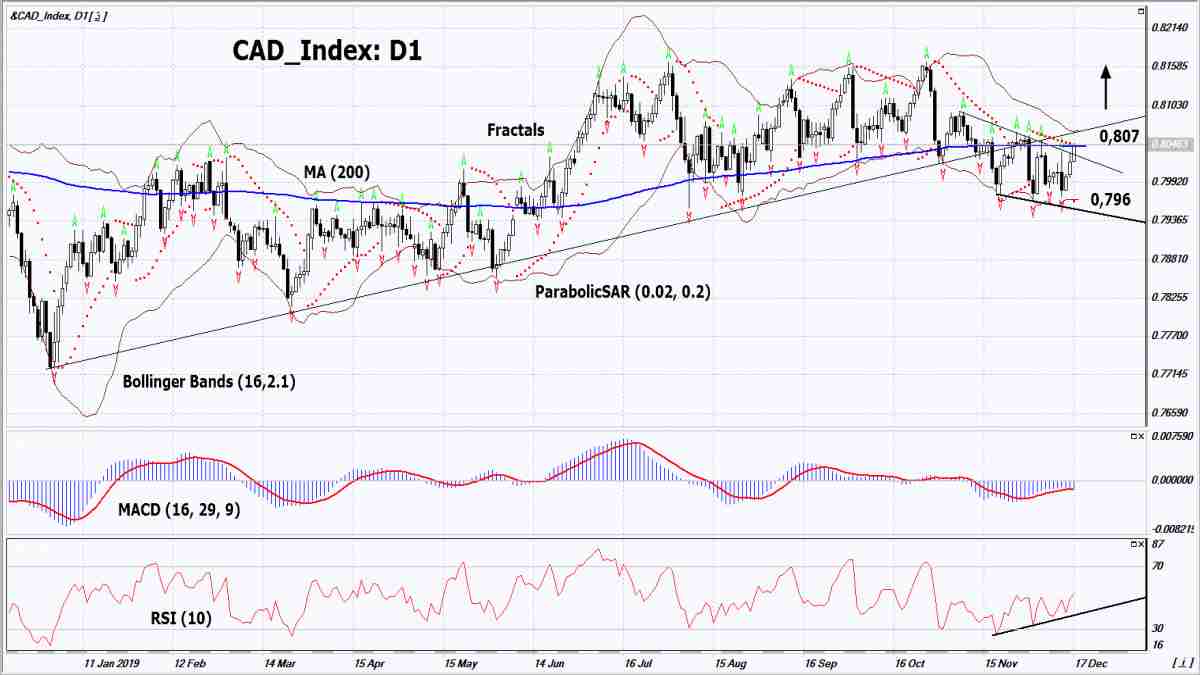
On the daily timeframe, the CAD_Index: D1 is correcting up and has exceeded the resistance line of the short-term downtrend. A number of technical analysis indicators formed buy signals. The further price growth is possible in case of positive news in Canada and an increase in oil prices.
- The Parabolic indicator gives a bullish signal.
- The Bollinger bands have narrowed, which indicates low volatility. Both Bollinger bands are titled upward.
- The RSI indicator is above 50. It has formed a positive divergence.
- The MACD indicator gives a bullish signal.
The bullish momentum may develop in case CAD_Index exceeds the 200-day moving average line and the upper Bollinger band at 0.807. This level may serve as an entry point. The initial stop loss may be placed below the last fractal low, the Parabolic signal and the lower Bollinger band at 0.796. After opening the pending order, we shall move the stop to the next fractal low following the Bollinger and Parabolic signals. Thus, we are changing the potential profit/loss to the breakeven point. More risk-averse traders may switch to the 4-hour chart after the trade and place there a stop loss moving it in the direction of the trade. If the price meets the stop level (0.796) without reaching the order (0.807), we recommend closing the position: the market sustains internal changes that were not taken into account.
Summary of technical analysis
| Position | Buy |
| Buy stop | Above 0.807 |
| Stop loss | Below 0.796 |
Explore our
Trading Conditions
- Spreads from 0.0 pip
- 30,000+ Trading Instruments
- Stop Out Level - Only 10%
Ready to Trade?
Open Account Note:
This overview has an informative and tutorial character and is published for free. All the data, included in the overview, are received from public sources, recognized as more or less reliable. Moreover, there is no guarantee that the indicated information is full and precise. Overviews are not updated. The whole information in each overview, including opinion, indicators, charts and anything else, is provided only for familiarization purposes and is not financial advice or а recommendation. The whole text and its any part, as well as the charts cannot be considered as an offer to make a deal with any asset. IFC Markets and its employees under any circumstances are not liable for any action taken by someone else during or after reading the overview.
