- Analytics
- Technical Analysis
Cocoa Technical Analysis - Cocoa Trading: 2016-11-18
Lower shipments from Cote-d’Ivoire and Brazil
Global leader in cocoa production Cote-d’Ivoire allowed exporters to prolong the non-executed contracts for cocoa exports from previous season to 2016/17. This may cause additional demand of 60-120 thousand tonnes. Will cocoa surge?
Cocoa hit a fresh more than 3-year low on Thursday. Major reason for lower prices is very positive forecasts in Western Africa where 64% of world cocoa is produced. Now most meteorological agencies discuss La Nina phenomenon which may weigh on the forecasts. Cocoa shipments to export harbors of Cote-d’Ivoire fell 23% since the start of new season on October 1 to November 13, 2016 compared to the same period of previous year to 316 thousand tonnes. Quite the same story is in Brazil. Bahia Commercial Association reported that cocoa imports fell 29% since the start of agricultural season on May 1 to November 13, 2016. Brazil accounts for just about 5% of global cocoa production.
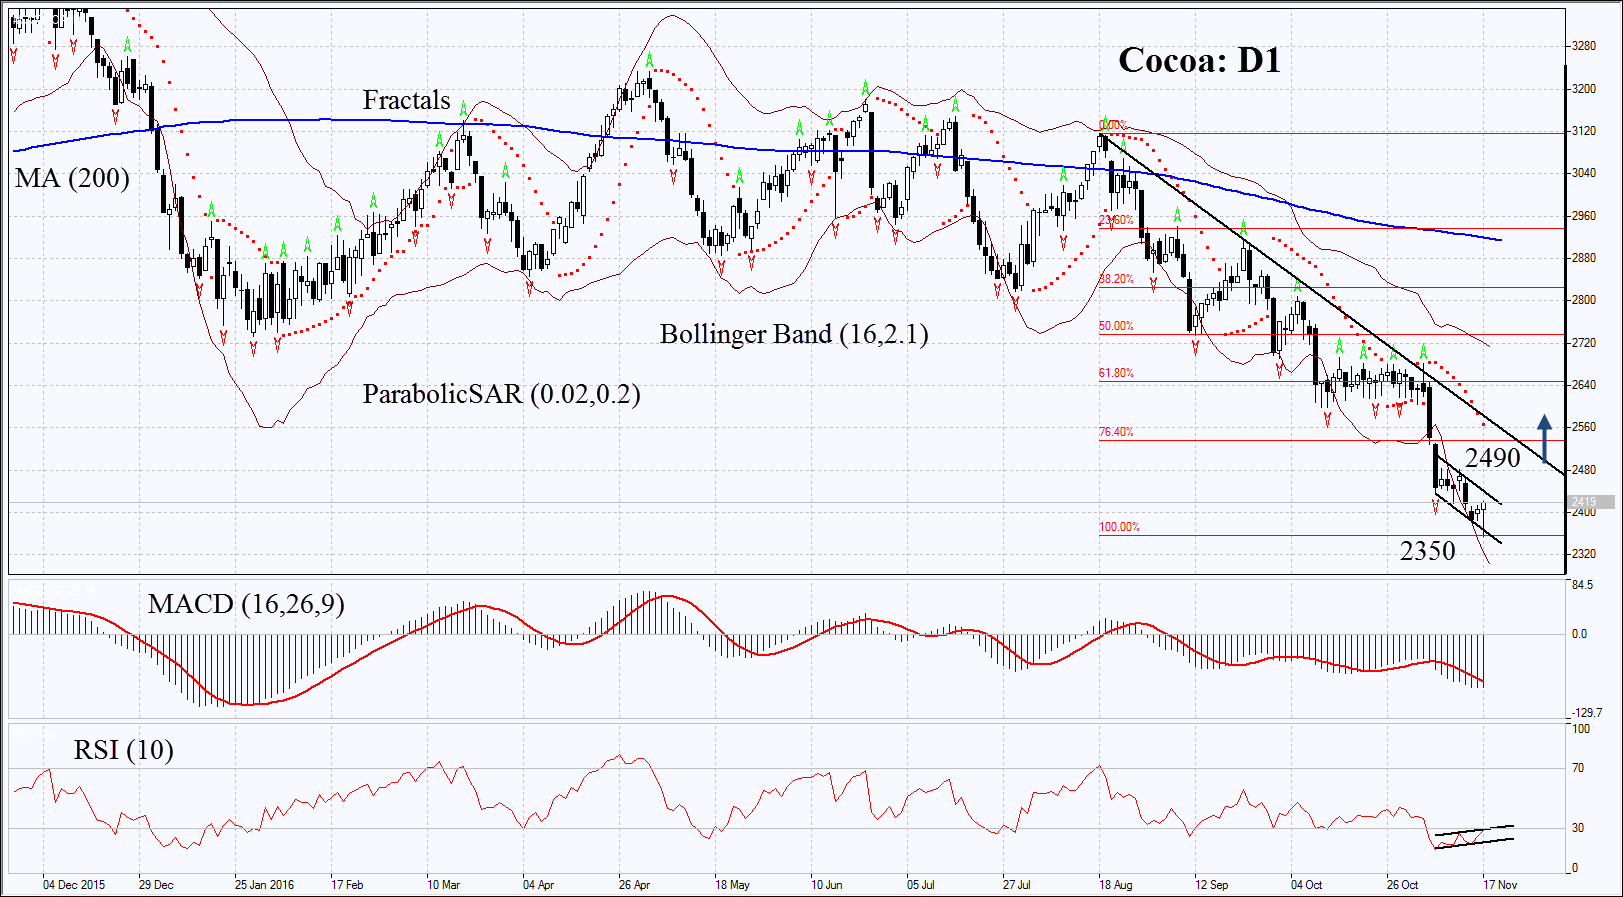
On the daily chart Cocoa: D1 slumped almost 25% since mid-August. The downward trend persists. Upward correction is possible in case of worse weather in main cocoa regions. Global demand remains steadily high and prices depend on weather conditions.
- Parabolic gives bearish signal.
- Bollinger bands have widened which means higher volatility.
- RSI has reached the oversold zone. It has formed positive divergence. It is the only indicator which points at possible upward correction.
- MACD gives bearish signals.
The bullish momentum may develop in case cocoa leaves the downtrend to move upwards at 2490. This level may serve the point of entry. The initial stop-loss may be placed below the 3-year low at 2350. Having opened the pending order we shall move the stop to the next fractal low following the Parabolic and Bollinger signals. Thus, we are changing the probable profit/loss ratio to the breakeven point. The most risk-averse traders may switch to the 4-hour chart after the trade and place there a stop-loss moving it in the direction of the trade. If the price meets the stop-loss level at 2350 without reaching the order at 2490 we recommend cancelling the position: the market sustains internal changes which were not taken into account.
Summary of technical analysis
| Position | Buy |
| Buy stop | above 2490 |
| Stop loss | below 2350 |
Explore our
Trading Conditions
- Spreads from 0.0 pip
- 30,000+ Trading Instruments
- Stop Out Level - Only 10%
Ready to Trade?
Open Account Note:
This overview has an informative and tutorial character and is published for free. All the data, included in the overview, are received from public sources, recognized as more or less reliable. Moreover, there is no guarantee that the indicated information is full and precise. Overviews are not updated. The whole information in each overview, including opinion, indicators, charts and anything else, is provided only for familiarization purposes and is not financial advice or а recommendation. The whole text and its any part, as well as the charts cannot be considered as an offer to make a deal with any asset. IFC Markets and its employees under any circumstances are not liable for any action taken by someone else during or after reading the overview.
