- Analytics
- Technical Analysis
Cocoa Technical Analysis - Cocoa Trading: 2019-04-01
Bad weather conditions can reduce cocoa yield.
The rainy season begins in Côte d'Ivoire, which runs from mid-March to late October. Will the quotations for cocoa rise?
Of course, the rainy season itself does not affect the cost of the beans. However, heavy precipitation is now expected in the coastal and southern regions of the country, and drought may be in the center. Côte d'Ivoire is the world's largest cocoa producer with a 35% share. It is followed by several more countries from West Africa: Ghana (share in the world cocoa harvest is 25%), Cameroon (+ 5%) and Nigeria (+ 6%). Bad weather conditions can have a negative impact on the harvest in the entire region and contribute to higher prices. In addition, according to U.S. Commodity Futures Trading Commission on March 22, the volume of short positions for sale (net short position) of cocoa on the ICE exchange peaked from September 2017. After the price of beans has risen, the players had to urgently close these positions, which could be an additional impetus to the growth of quotations.
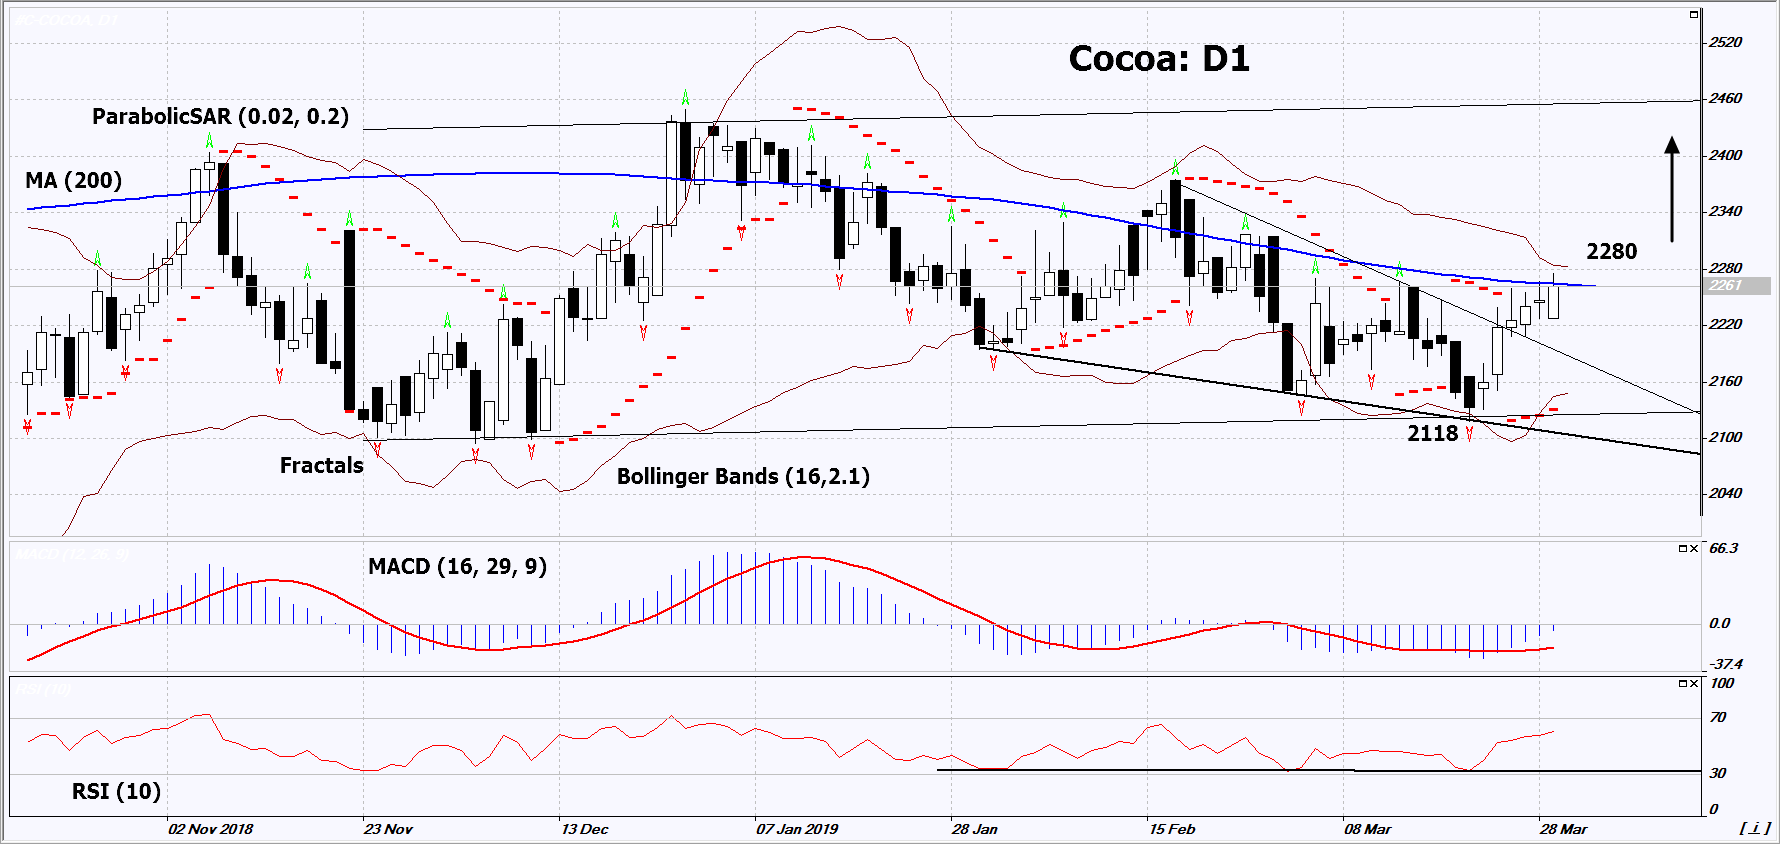
On the daily timeframe , Cocoa: D1 is out of the short-term downtrend. Now it is in a long-term neutral trend and moves towards its upper boundary. Various indicators of technical analysis formed improvement signals . Further growth of quotations is possible in case of bad weather and a reduction in world yield.
- The Parabolic Indicator shows buy signal.
- The Bollinger bands have narrowed which indicates high volatility. Both Bollinger lines have a slope up
- The RSI Indicator is above the 50 mark. It formed a divergence to the rise.
- The MACD Indicator gives a bullish signal.
The bullish momentum may develop in case if Cocoa will exceed the upper line of the Bollinger: 2280. This level may serve as an entry point. The initial risk limit is possibly below the last lower fractal, the Parabolic signal and the lower Bollinger line: 2118. After opening the pending order, we shall move the stop to the next fractal low following the Bollinger and Parabolic signal to the the next fractal minimum. Thus, we are changing the potential profit/loss to the breakeven point. More risk-averse traders may switch to the 4-hour chart after the trade and place there a stop loss moving it in the direction of the trade. In case if the market price overcomes the stop level (2118) without activating the order (2280),we recommend to close the position: the market sustains internal changes that were not taken into account.
Technical Analysis Summary
| Position | Buy |
| Buy stop | Above 2280 |
| Stop loss | Below 2118 |
Explore our
Trading Conditions
- Spreads from 0.0 pip
- 30,000+ Trading Instruments
- Stop Out Level - Only 10%
Ready to Trade?
Open Account Note:
This overview has an informative and tutorial character and is published for free. All the data, included in the overview, are received from public sources, recognized as more or less reliable. Moreover, there is no guarantee that the indicated information is full and precise. Overviews are not updated. The whole information in each overview, including opinion, indicators, charts and anything else, is provided only for familiarization purposes and is not financial advice or а recommendation. The whole text and its any part, as well as the charts cannot be considered as an offer to make a deal with any asset. IFC Markets and its employees under any circumstances are not liable for any action taken by someone else during or after reading the overview.
