- Analytics
- Technical Analysis
COPPER Technical Analysis - COPPER Trading: 2017-01-31
Indonesia plans to allow copper exports
Indonesia is planning to issue a temporary permit for copper concentrate export from Grasberg field For the US Freeport McMoRan company. Will copper continue falling in price?
Freeport McMoRan is global leader in copper production. Ore is extracted in the Grasberg field each month to smelt into 70mln pounds of the metal which is around 2% of global production. This volume will reappear in global markets. A ban on copper ore and concentrate exports was introduced by government of Indonesia on January 12, 2014 in order to support the local copper smelting plants. The export permit for Freeport McMoRan may be issed for 6 months. The additional negative for copper is that investors may start taking profits ahead of Trump’s release of his plans to support the US economy. His first acts concerned not economy but migration. The major improvement of global demand for copper is taking place in China, according to International Copper Study Group. Thus, Chinese economic data may affect copper prices. They will start coming out after the Lunar New Year. In particular, on Wednesday February 1 the Manufacturing PMI for January will come out in China, the tentative outlook is moderately negative.
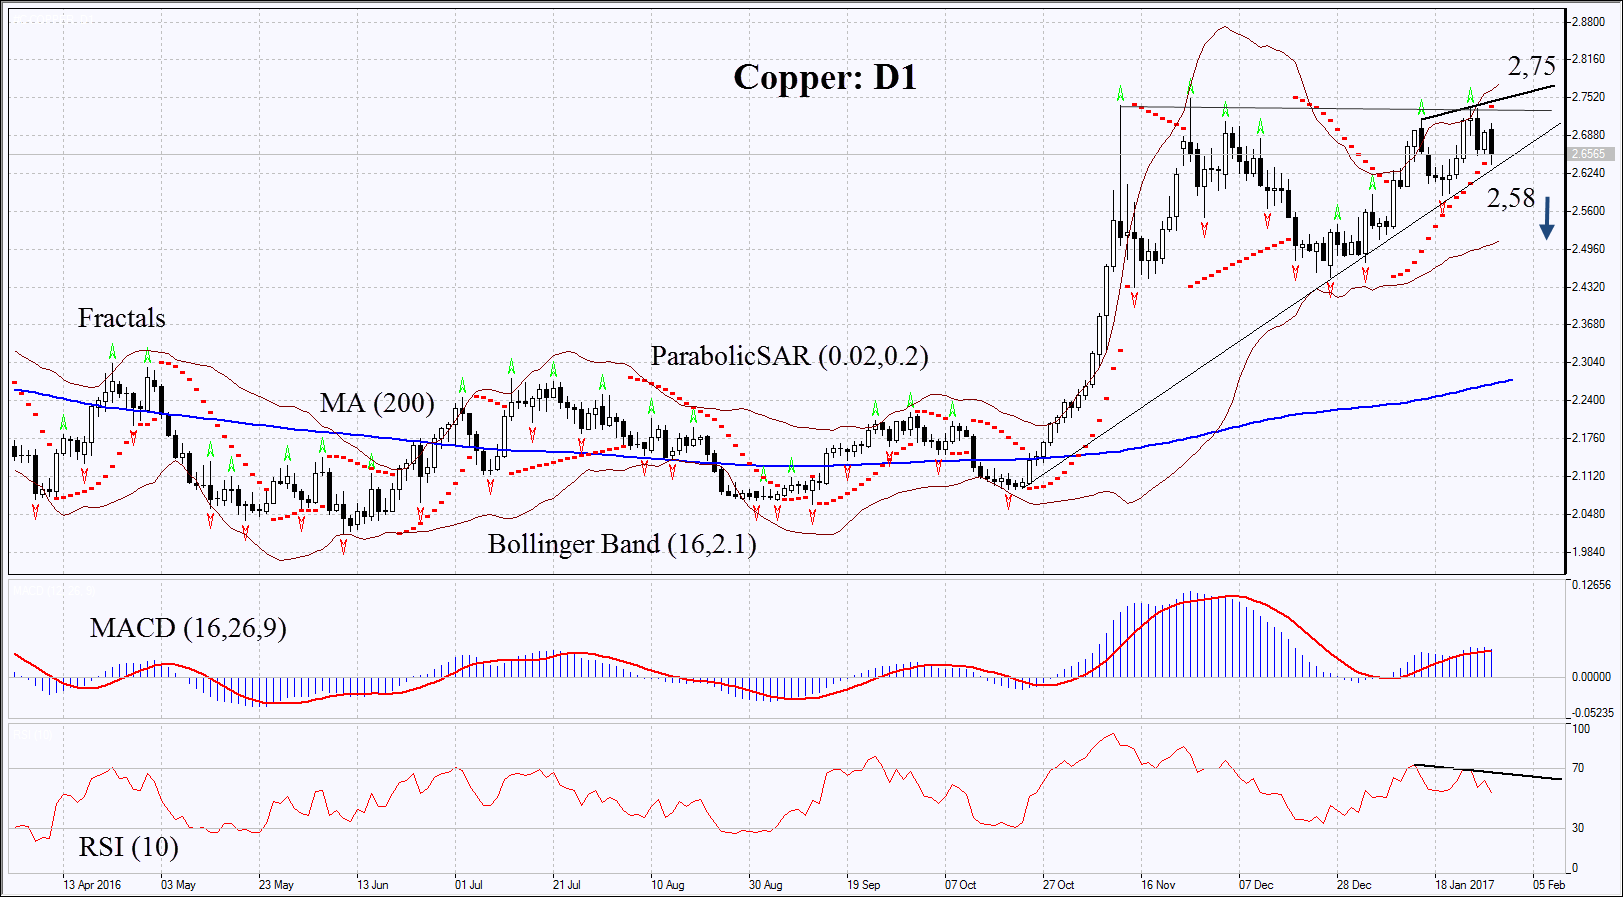
On the daily chart Copper: D1 is correcting within the triangle. Thus, the short position may be opened when the copper leaves the triangle to move down. Copper prices may fall in case of higher export from Indonesia and weak economic data in China.
- The Parabolic gives bearish signal.
- The Bollinger bands have widened which means higher volatility.
- The RSI is above 50. It has formed negative divergence.
- The MACD gives bearish signals.
The bearish momentum may develop in case the Copper falls below the last fractal low and the support of the triangle 2.58. This level may serve the point of entry. The initial stop-loss may be placed above the 20-month high, the upper boundary of triangle and the Parabolic signal at 2.75. Having opened the pending order we shall move the stop to the next fractal high following the Parabolic and Bollinger signals. Thus, we are changing the probable profit/loss ratio to the breakeven point. The most risk-averse traders may switch to the 4-hour chart after the trade and place there a stop-loss moving it in the direction of the trade. If the price meets the stop-loss level at 2.75 without reaching the order at 2.58, we recommend cancelling the position: the market sustains internal changes which were not taken into account.
Summary of technical analysis
| Position | Sell |
| Sell stop | below 2.58 |
| Stop loss | above 2.75 |
Explore our
Trading Conditions
- Spreads from 0.0 pip
- 30,000+ Trading Instruments
- Stop Out Level - Only 10%
Ready to Trade?
Open Account Note:
This overview has an informative and tutorial character and is published for free. All the data, included in the overview, are received from public sources, recognized as more or less reliable. Moreover, there is no guarantee that the indicated information is full and precise. Overviews are not updated. The whole information in each overview, including opinion, indicators, charts and anything else, is provided only for familiarization purposes and is not financial advice or а recommendation. The whole text and its any part, as well as the charts cannot be considered as an offer to make a deal with any asset. IFC Markets and its employees under any circumstances are not liable for any action taken by someone else during or after reading the overview.
