- Analytics
- Technical Analysis
Cotton Technical Analysis - Cotton Trading: 2017-06-16
Cotton prices fall as import demand is expected to fall
Cotton prices are declining as cotton import demand is expected to fall. Will cotton continue falling?
In the June 9 World Agricultural Supply and Demand Estimates report, the US Department of Agriculture revised downward the 2017-18 world import demand by nearly 800000 bales 480-pound each, with global trade reduced 2%. Export estimates were lowered for the US, India, Brazil and others primarily due to lower expected demand by Pakistan and Mexico. Around the world farmers planted more acres after cotton prices jumped 12% last year. American growers, the biggest exporters, are forecast to have their biggest harvest in a decade. Crops will be higher in India and Australia too. At the same time China is selling its state cotton reserves and there are no signs inventory sales are slowing down. Higher supply and expected lower import demand are bearish for cotton prices.
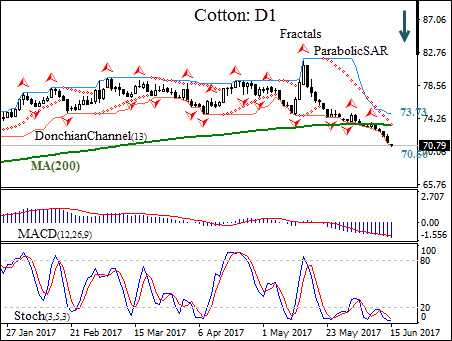
On the daily timeframe the Cotton: D1 has been retracing lower following the rally after hitting one year high in mid-May. The price has fallen below the 200-day moving average MA(200) which has levelled off.
- The Parabolic indicator has formed a sell signal.
- The Donchian channel indicates a downtrend: it is tilted downward.
- The MACD indicator gives a bearish signal.
- The Stochastic oscillator is in the oversold zone, which is a bullish signal.
We expect the bearish momentum will continue after the price breaches below the lower Donchian bound at 70.50. This level can be used as an entry point for a pending order to sell. The stop loss can be placed above the fractal high at 73.73. After placing the pending order, the stop loss is to be moved to the next fractal low, following Parabolic signals. By doing so, we are changing the probable profit/loss ratio to the breakeven point. If the price meets the stop loss level (73.73) without reaching the order (70.50), we recommend canceling the position: the market sustains internal changes which were not taken into account.
Technical Analysis Summary
| Position | Sell |
| Sell stop | Below 70.50 |
| Stop loss | Above 73.73 |
Explore our
Trading Conditions
- Spreads from 0.0 pip
- 30,000+ Trading Instruments
- Stop Out Level - Only 10%
Ready to Trade?
Open Account Note:
This overview has an informative and tutorial character and is published for free. All the data, included in the overview, are received from public sources, recognized as more or less reliable. Moreover, there is no guarantee that the indicated information is full and precise. Overviews are not updated. The whole information in each overview, including opinion, indicators, charts and anything else, is provided only for familiarization purposes and is not financial advice or а recommendation. The whole text and its any part, as well as the charts cannot be considered as an offer to make a deal with any asset. IFC Markets and its employees under any circumstances are not liable for any action taken by someone else during or after reading the overview.
