- Analytics
- Technical Analysis
Cotton Technical Analysis - Cotton Trading: 2018-04-12
Global stock forecast cut bullish for cotton prices
Cotton prices advance as global cotton stock forecast was lowered. Will cotton continue climbing?
US Department of Agriculture revised its world cotton opening stocks downwards by 900,000 bales for April according to WASDE report. At the same time the USDA its forecast for world ending stocks for 2017-18 by 600,000 bales. Lower world inventories are bullish for cotton prices.
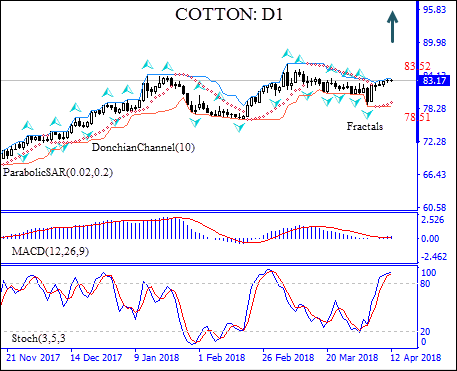
On the daily timeframe the Cotton: D1 has been retracing following the decline after hitting four-year high in the beginning of March.
- The Parabolic indicator has formed a buy signal.
- The Donchian channel indicates an uptrend: it is tilted upward.
- The MACD indicator gives a bullish signal.
- The Stochastic oscillator is in the overbought zone which is bearish.
We expect the bullish momentum will continue after the price closes above the upper bound of the Donchian channel at 83.52. A price point above that level can be used as an entry point for a pending order to buy. The stop loss can be placed below the fractal low at 78.51. After placing the pending order the stop loss is to be moved to the next fractal low following Parabolic signals. Thus, we are changing the profit/loss ratio to the breakeven point. If the price meets the stop loss level (78.51) without reaching the order (83.52), we recommend cancelling the order: the market sustains internal changes which were not taken into account.
Technical Analysis Summary
| Position | Buy |
| Buy stop | Above 83.52 |
| Stop loss | Below 78.51 |
Explore our
Trading Conditions
- Spreads from 0.0 pip
- 30,000+ Trading Instruments
- Stop Out Level - Only 10%
Ready to Trade?
Open Account Note:
This overview has an informative and tutorial character and is published for free. All the data, included in the overview, are received from public sources, recognized as more or less reliable. Moreover, there is no guarantee that the indicated information is full and precise. Overviews are not updated. The whole information in each overview, including opinion, indicators, charts and anything else, is provided only for familiarization purposes and is not financial advice or а recommendation. The whole text and its any part, as well as the charts cannot be considered as an offer to make a deal with any asset. IFC Markets and its employees under any circumstances are not liable for any action taken by someone else during or after reading the overview.
