- Analytics
- Technical Analysis
EU 50 Index Technical Analysis - EU 50 Index Trading: 2017-05-30
Higher political risks in Europe
The European stocks decline in price for the 4th consecutive day amid higher political risks in Italy, Greece and the United Kingdom. Will the decrease of the Euro STOXX50 index continue?
Early parliamentary elections are expected in Italy. They can be held simultaneously with the German elections in September this year. Greece again faces the default risk on government debts after postponing the negotiations with the IMF to mid-June. In Britain, the gap between the Conservative and Labor parties has narrowed ahead of the parliamentary elections next week. The STOXX50 index rose for the fourth month in a row in May updating a nearly 2-year high. Deutsche Bank lowered its recommendations on the European banks’ shares on this background, while JPMorgan lowered its recommendations on automakers stocks. The current P/E ratio of STOXX50 index is 21.8. This is markedly above the historical average of 14. High P/E ratio may indicate an overestimation of the index.
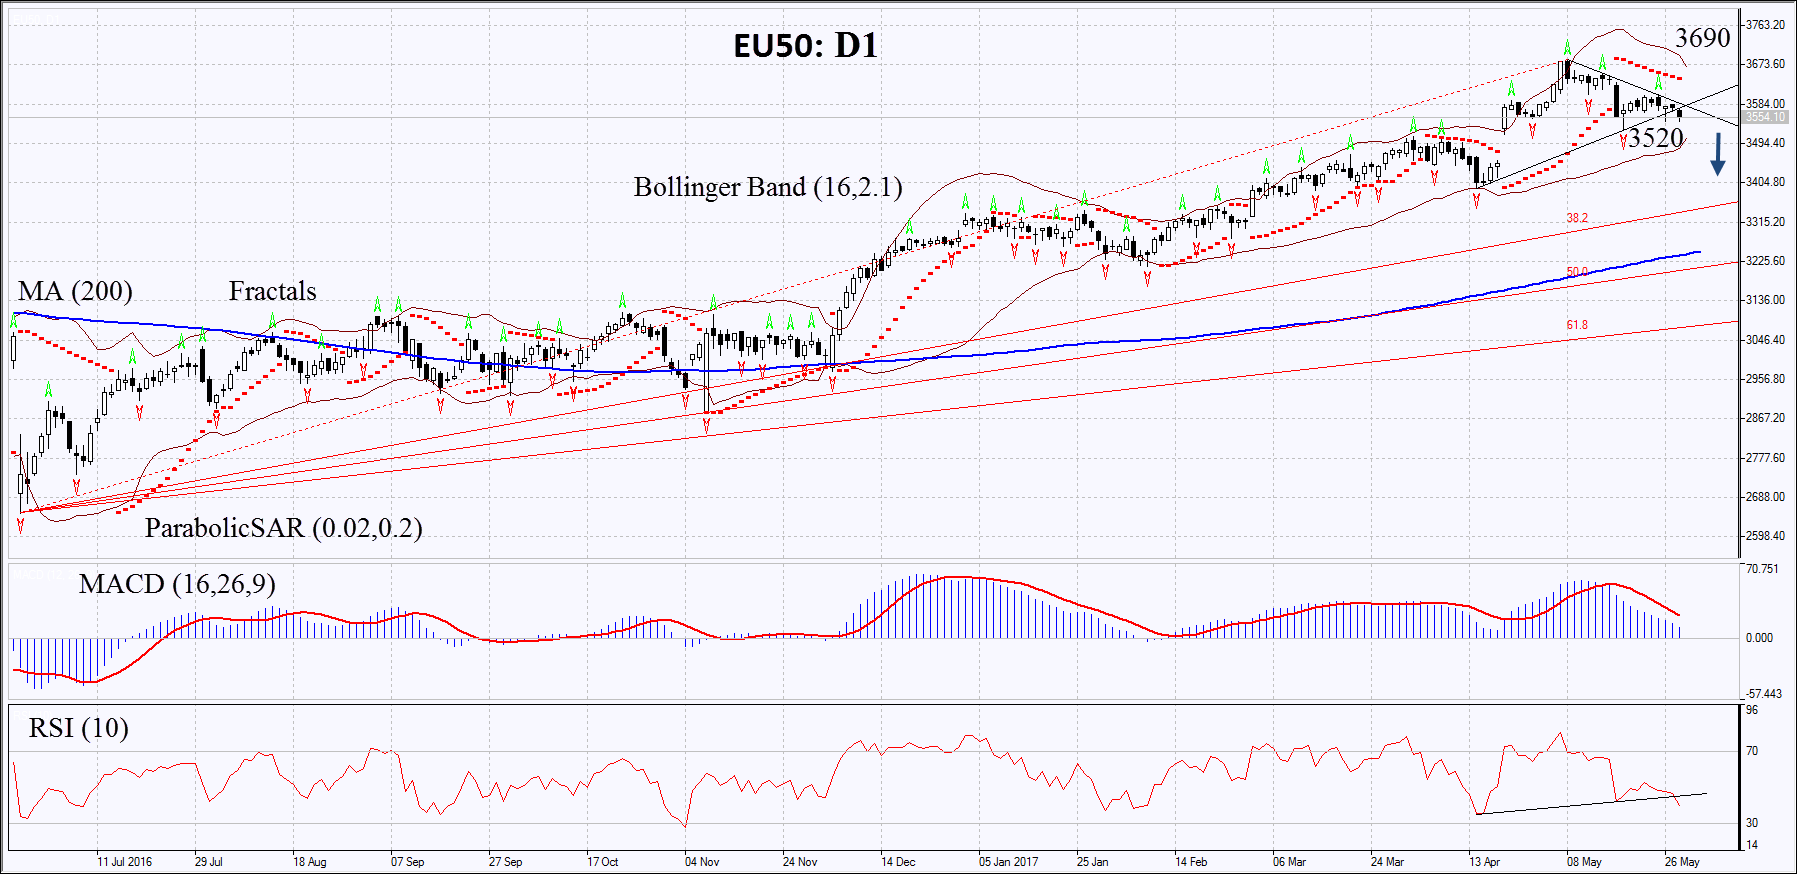
On the daily timeframe, EU50: D1 broke down through the support line of the rising channel and is trying to correct down. The further price decrease is possible in case of the publication of weak economic data in the Eurozone, negative corporate reports and higher political risks.
- The Parabolic indicator gives a bearish signal.
- The Bollinger bands have narrowed, which means lower volatility.
- The RSI is below 50. No divergence.
- The MACD gives a bearish signal.
The bearish momentum may develop in case EU50 drops below the last fractal low at 3520. This level may serve as the entry point. The initial stop loss may be placed above the 3 last fractal highs, the 2-year high, the Parabolic signal and the upper Bollinger band at 3690. After opening the pending order, we shall move the stop to the next fractal high following the Bollinger and Parabolic signals. Thus, we are changing the potential profit/loss to the breakeven point. More risk-averse traders may switch to the 4-hour chart after the trade and place there a stop loss moving it in the direction of the trade. If the price meets the stop level at 3690 without reaching the order at 3520 we recommend cancelling the position: the market sustains internal changes that were not taken into account.
Summary of technical analysis
| Position | Sell |
| Sell stop | below 3520 |
| Stop loss | above 3690 |
Explore our
Trading Conditions
- Spreads from 0.0 pip
- 30,000+ Trading Instruments
- Stop Out Level - Only 10%
Ready to Trade?
Open Account Note:
This overview has an informative and tutorial character and is published for free. All the data, included in the overview, are received from public sources, recognized as more or less reliable. Moreover, there is no guarantee that the indicated information is full and precise. Overviews are not updated. The whole information in each overview, including opinion, indicators, charts and anything else, is provided only for familiarization purposes and is not financial advice or а recommendation. The whole text and its any part, as well as the charts cannot be considered as an offer to make a deal with any asset. IFC Markets and its employees under any circumstances are not liable for any action taken by someone else during or after reading the overview.
