- Analytics
- Technical Analysis
EUR USD Technical Analysis - EUR USD Trading: 2017-09-19
Expecting the Fed meeting and the ECB president speech
This Wednesday, September 20, 2017, the next US Fed meeting will take place. No rate hike is expected, but the dollar may strengthen in case of positive statements by the US regulator. Is there a possibility for the EURUSD to decline?
The Fed may announce a possible rate increase at its next meetings this year: on November 1 or December 13. The Fed may also report a reduction in the volume of bonds on its balance sheet, which currently amounts to $4.5 trillion. Such announcements may strengthen the dollar. On Thursday and Friday, September 21 - 22, 2017, the ECB president Mario Draghi will speak. If he does not announce plans to reverse the monetary stimulus policy again, this could have a negative impact on the euro. Let us recall that last week, a Member of the Executive Board of the European Central Bank Benoit Coeure said that in order to increase inflation in the eurozone to the target level of 2%, it is necessary to continue pursuing easy monetary policy. This stopped the growth of the euro. Note that according to the CFTC, the volume of US dollar net short positions increased for the 4th consecutive week and reached a 4.5 - year high. Their possible closure may provide an additional support for the US currency.
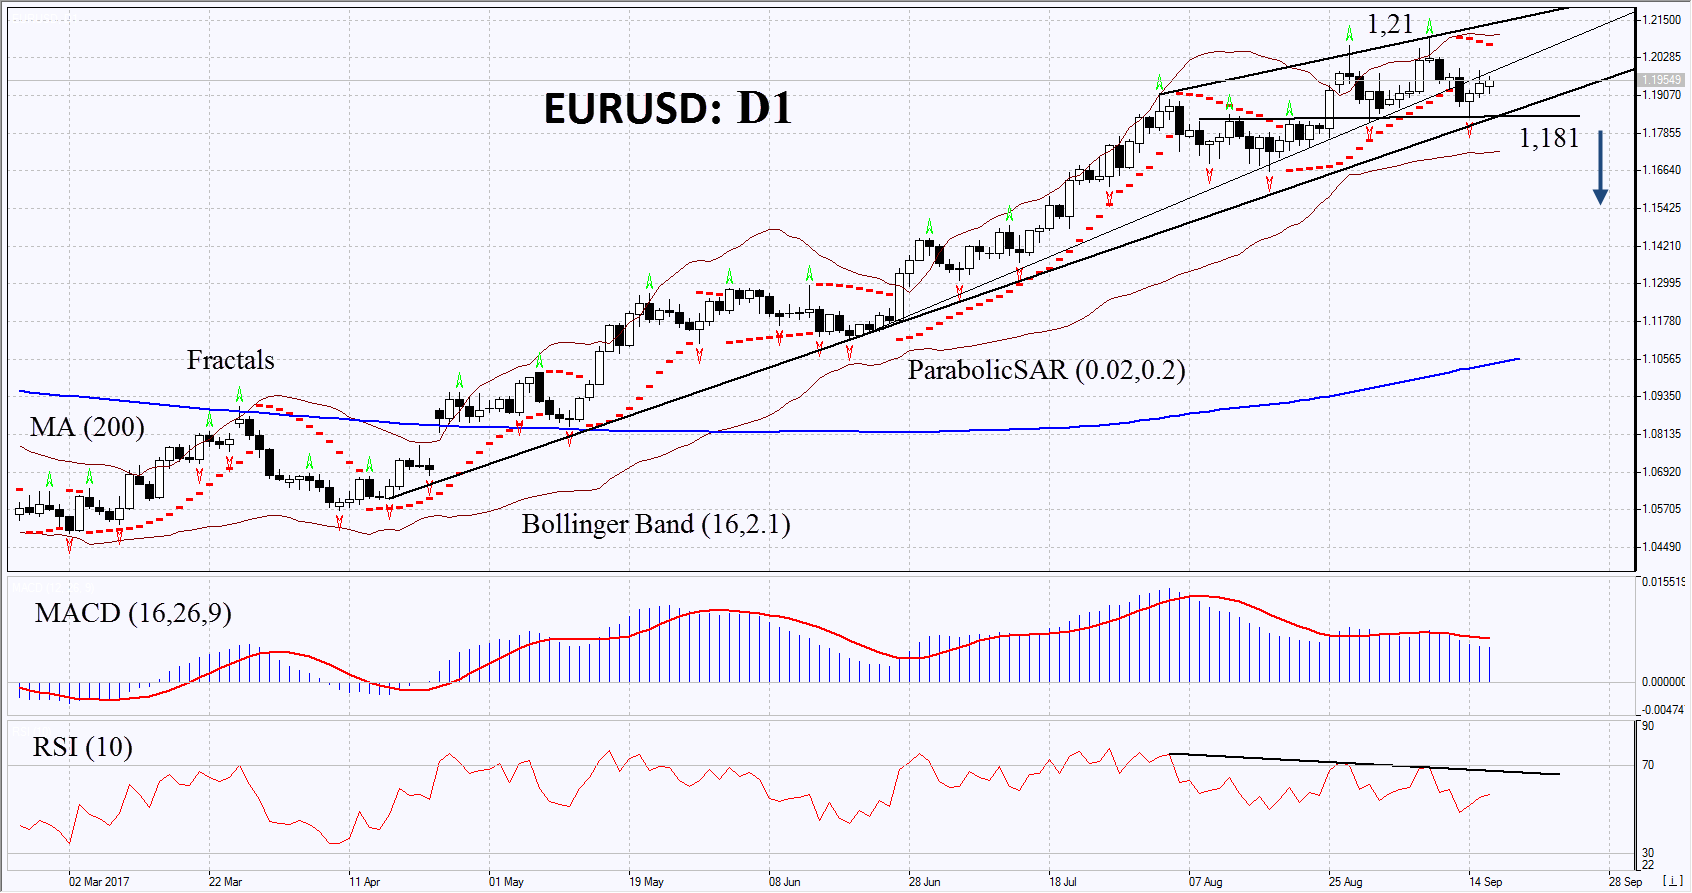
On the daily timeframe, EURUSD: D1 came out from the rising trend to neutral. At the same time, a number of indicators formed bearish signals. A downward correction is possible in case the Fed has plans to raise the rate this year, as well as in case the ECB refrains from increasing its rate in the nearest future.
- The Parabolic indicator gives a bearish signal.
- The Bollinger bands have narrowed, which means low volatility.
- The RSI indicator is above 50. It has formed a negative divergence.
- The MACD indicator gives a bearish signal.
The bearish momentum may develop in case EURUSD drops below the two last fractal lows at 1.181. This level may serve as an entry point. The initial stop loss may be placed above the last fractal high, the 3.5 - year high, the upper Bollinger band and the Parabolic signal at 1.21. After opening the pending order, we shall move the stop to the next fractal high following the Bollinger and Parabolic signals. Thus, we are changing the potential profit/loss to the breakeven point. More risk-averse traders may switch to the 4-hour chart after the trade and place there a stop loss moving it in the direction of the trade. If the price meets the stop level at 1.21 without reaching the order at 1.181 we recommend cancelling the position: the market sustains internal changes that were not taken into account.
Summary of technical analysis
| Position | Sell |
| Sell stop | below 1,181 |
| Stop loss | above 1,21 |
Explore our
Trading Conditions
- Spreads from 0.0 pip
- 30,000+ Trading Instruments
- Stop Out Level - Only 10%
Ready to Trade?
Open Account Note:
This overview has an informative and tutorial character and is published for free. All the data, included in the overview, are received from public sources, recognized as more or less reliable. Moreover, there is no guarantee that the indicated information is full and precise. Overviews are not updated. The whole information in each overview, including opinion, indicators, charts and anything else, is provided only for familiarization purposes and is not financial advice or а recommendation. The whole text and its any part, as well as the charts cannot be considered as an offer to make a deal with any asset. IFC Markets and its employees under any circumstances are not liable for any action taken by someone else during or after reading the overview.
