- Analytics
- Technical Analysis
FCATTLE Technical Analysis - FCATTLE Trading: 2017-08-29
Hurricane Harvey may damage the US cattle breeding
Thousands of heads of cattle in feedlots may suffer because of Hurricane Harvey. Will the FCATTLE quotes grow?
The brunt of Hurricane Harvey fell on the US states of Louisiana and Texas, which are the leaders in beef production. Meanwhile the economic damage is estimated at $40 bln, but the figure will be elaborated. An additional factor for the possible price increase may be the monthly survey of the USDA. In July, 2017, the number of calves placed in feedlots increased by 2.7% and amounted to 1.615 mln heads. This is by 2.7% higher than the July figure of the last year. The data may disappoint market participants, who expected a growth by 6.2%. Nevertheless, according to the Livestock Marketing Information Center, even such an increase in supply could cut the incomes of feedlots twofold in July compared to June of this year. This may encourage farmers to reduce the number of calves in the future.
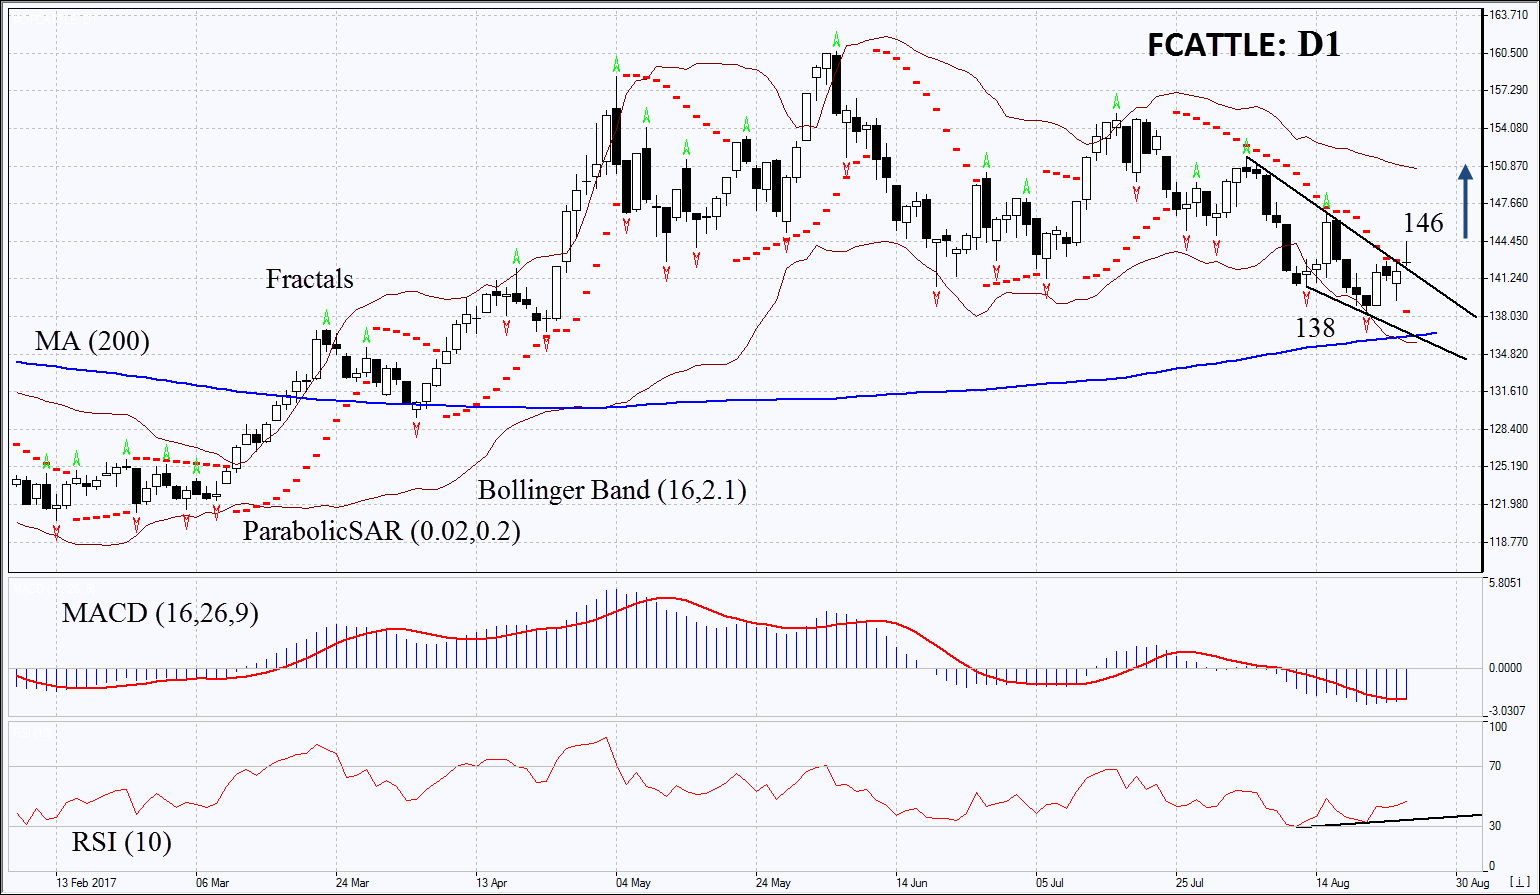
On the daily timeframe, FCATTLE: D1 came out of the downtrend and is moving upwards. The further price increase is possible in case of the marked damage of the US meat production sector by Hurricane Harvey.
- The Parabolic indicator gives a bullish signal.
- The Bollinger bands widened, which means higher volatility. They are tilted upwards.
- The RSI indicator is below 50. It has formed a positive divergence.
- The MACD indicator gives a bullish signal.
The bullish momentum may develop in case FCATTLE exceeds the last fractal high at 146. This level may serve as an entry point. The initial stop loss may be placed below the last fractal low and the Parabolic signal at 138. After opening the pending order, we shall move the stop to the next fractal low following the Bollinger and Parabolic signals. Thus, we are changing the potential profit/loss to the breakeven point. More risk-averse traders may switch to the 4-hour chart after the trade and place there a stop loss moving it in the direction of the trade. If the price meets the stop level at 146 without reaching the order at 138 we recommend cancelling the position: the market sustains internal changes that were not taken into account.
Summary of technical analysis
| Position | Buy |
| Buy stop | above 146 |
| Stop loss | below 138 |
Explore our
Trading Conditions
- Spreads from 0.0 pip
- 30,000+ Trading Instruments
- Stop Out Level - Only 10%
Ready to Trade?
Open Account Note:
This overview has an informative and tutorial character and is published for free. All the data, included in the overview, are received from public sources, recognized as more or less reliable. Moreover, there is no guarantee that the indicated information is full and precise. Overviews are not updated. The whole information in each overview, including opinion, indicators, charts and anything else, is provided only for familiarization purposes and is not financial advice or а recommendation. The whole text and its any part, as well as the charts cannot be considered as an offer to make a deal with any asset. IFC Markets and its employees under any circumstances are not liable for any action taken by someone else during or after reading the overview.
