- Analytics
- Technical Analysis
GBP Currency Index Technical Analysis - GBP Currency Index Trading: 2018-01-15
The probability of "soft" Brexit has increased
In this review, we suggest considering the personal composite instrument (PCI) "GBP Currency Index". The currency index is intended for trading the British pound against the rest of the Forex market segment. Will the GBP_Index quotes advance?
On Friday, the British pound updated its high against the US dollar since June 2016, when a referendum was held on Britain’s exit from the European Union. Investors reacted positively to the statement by the finance ministers of Spain and the Netherlands that they support the "soft" version of Brexit. Thus, the two countries are in favor of maintaining strong trade relations with the UK after its exit from the EU. Earlier, the EU representatives announced that mutual trade could suffer significantly because of Brexit. On Tuesday, January 16, 2018 inflation data for December will come out in the UK, which may affect the dynamics of the British pound. According to preliminary forecasts, the growth of consumer prices may slow down.
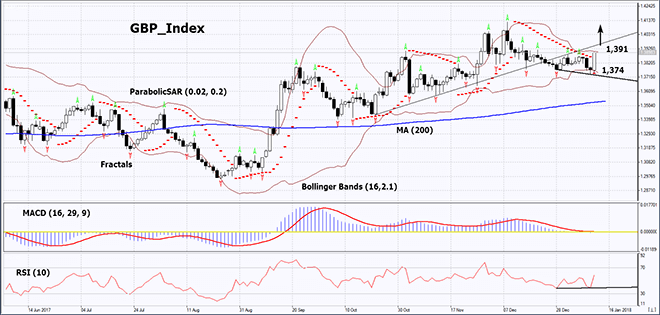
On the daily timeframe, GBP_Index: D1 is in the neutral range. The further price increase is possible in case of the publication of positive economic data in the UK and a progress in Brexit negotiations.
- The Parabolic indicator gives a bullish signal.
- The Bollinger bands have markedly narrowed, which means lower volatility.
- The RSI indicator is above 50. It has formed a weak positive divergence.
- The MACD indicator gives a bullish signal.
The bullish momentum may develop in case GBP_Index exceeds the upper Bollinger band at 1.391. This level may serve as an entry point. The initial stop loss may be placed below the Parabolic signal, the lower Bollinger band and the last fractal low at 1.374. After opening the pending order, we shall move the stop to the next fractal low following the Bollinger and Parabolic signals. Thus, we are changing the potential profit/loss to the breakeven point. More risk-averse traders may switch to the 4-hour chart after the trade and place there a stop loss moving it in the direction of the trade. If the price meets the stop level at 1.374 without reaching the order at 1.391, we recommend cancelling the position: the market sustains internal changes that were not taken into account.
Summary of technical analysis
| Position | Buy |
| Buy stop | above 1,391 |
| Stop loss | below 1,374 |
Explore our
Trading Conditions
- Spreads from 0.0 pip
- 30,000+ Trading Instruments
- Stop Out Level - Only 10%
Ready to Trade?
Open Account Note:
This overview has an informative and tutorial character and is published for free. All the data, included in the overview, are received from public sources, recognized as more or less reliable. Moreover, there is no guarantee that the indicated information is full and precise. Overviews are not updated. The whole information in each overview, including opinion, indicators, charts and anything else, is provided only for familiarization purposes and is not financial advice or а recommendation. The whole text and its any part, as well as the charts cannot be considered as an offer to make a deal with any asset. IFC Markets and its employees under any circumstances are not liable for any action taken by someone else during or after reading the overview.
