- Analytics
- Technical Analysis
Hang Seng Index Technical Analysis - Hang Seng Index Trading: 2017-04-11
Chinese stocks lose value after meeting of two heads of state
Chinese stocks retreated after the meeting of US president Donald Trump and China’s General Secretary Xi Jinping. Investors believe China will accept several economic requirements from US in order to avoid trade war. Will the Hong Kong stock index Hang Seng decline?
The US are mainly displeased with the huge trade deficit with China of $347bn a year. In fact, the sum is the surplus of Chinese companies and its decline may weigh on their financial statements. China may facilitate access of US investment companies to its financial market and lift a ban on US beef imports introduced in 2003. The US gained free access of their investment companies to the Chinese market since 2008. The additional negative for Hang Seng may be the higher political tensions in the Asian region after the US warships were sent to the North Korean shores. This week the significant economic data will come out in China which may affect the markets. The inflation data and producer price index will come out on Wednesday while the trade balance for March will be released on Thursday.
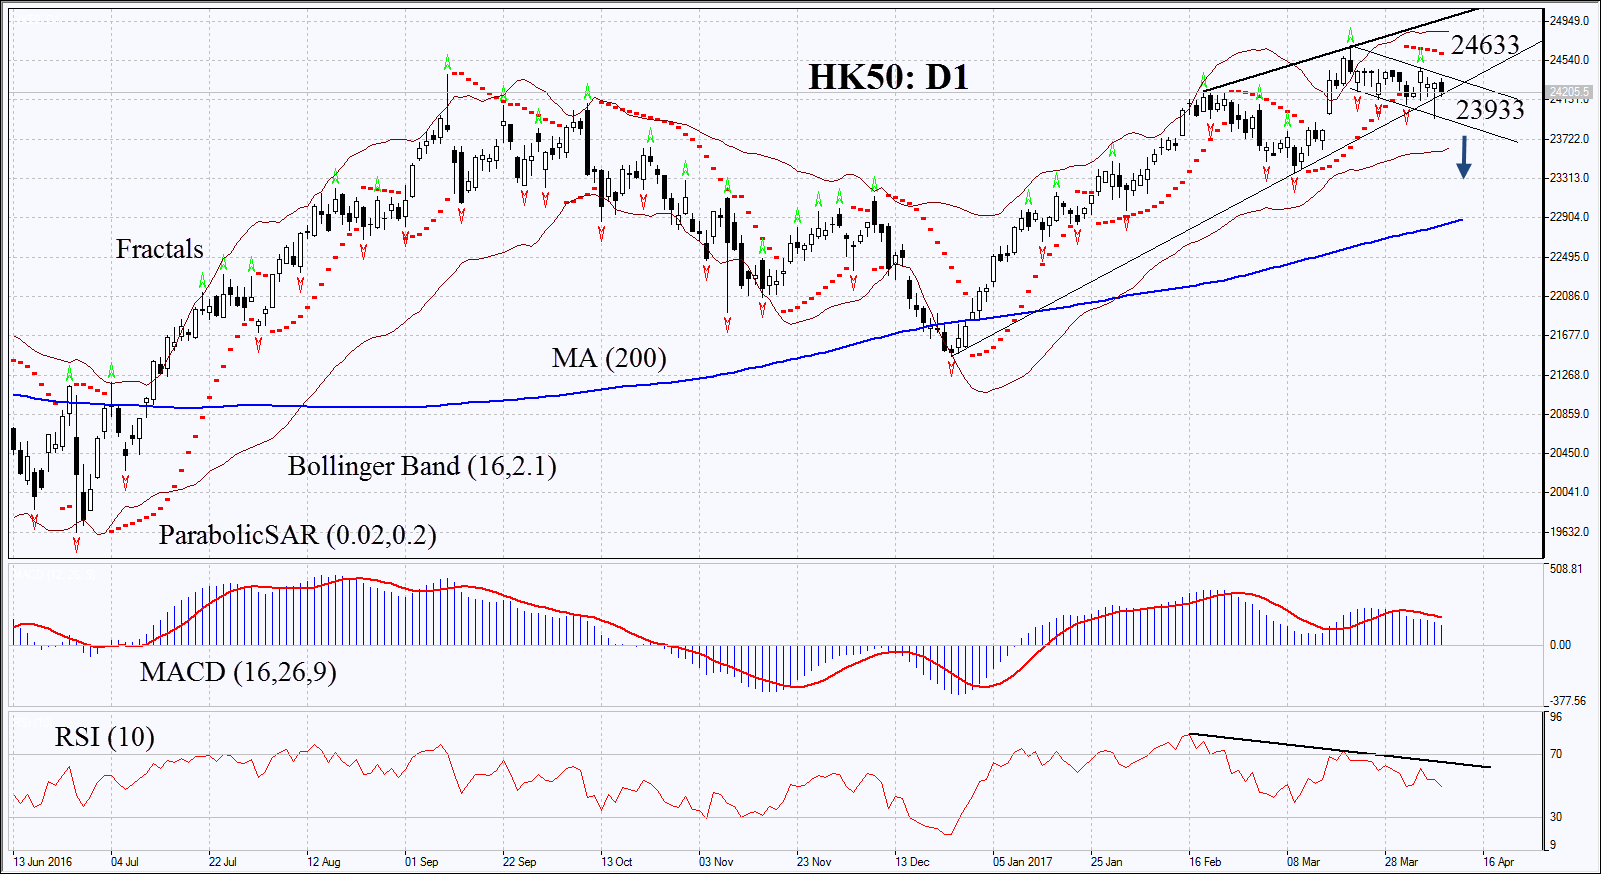
On the daily chart HK50: D1 has approached the support of the rising trend. Its further decline is possible in case of escalation in North Korea and weak economic data in China.
- Parabolic indicator gives bearish signal.
- Bollinger bands have widened which means ordinary volatility.
- RSI has fallen below 50. It has formed negative divergence.
- MACD gives bearish signals.
The bearish momentum may develop in case HK50 falls below the last fractal low at 23933. This level may serve the point of entry. The initial stop-loss may be placed above the Parabolic signal and the last fractal high at 24633. Having opened the pending order we shall move the stop to the next fractal high following the Parabolic and Bollinger signals. Thus, we are changing the probable profit/loss ratio to the breakeven point. The most risk-averse traders may switch to the 4-hour chart after the trade and place there a stop-loss moving it in the direction of the trade. If the price meets the stop-loss level at 24633 without reaching the order at 23933, we recommend cancelling the position: the market sustains internal changes which were not taken into account.
Summary of technical analysis
| Position | Sell |
| Sell stop | below 23933 |
| Stop loss | above 24633 |
Explore our
Trading Conditions
- Spreads from 0.0 pip
- 30,000+ Trading Instruments
- Stop Out Level - Only 10%
Ready to Trade?
Open Account Note:
This overview has an informative and tutorial character and is published for free. All the data, included in the overview, are received from public sources, recognized as more or less reliable. Moreover, there is no guarantee that the indicated information is full and precise. Overviews are not updated. The whole information in each overview, including opinion, indicators, charts and anything else, is provided only for familiarization purposes and is not financial advice or а recommendation. The whole text and its any part, as well as the charts cannot be considered as an offer to make a deal with any asset. IFC Markets and its employees under any circumstances are not liable for any action taken by someone else during or after reading the overview.
